MapAble Quick Overview
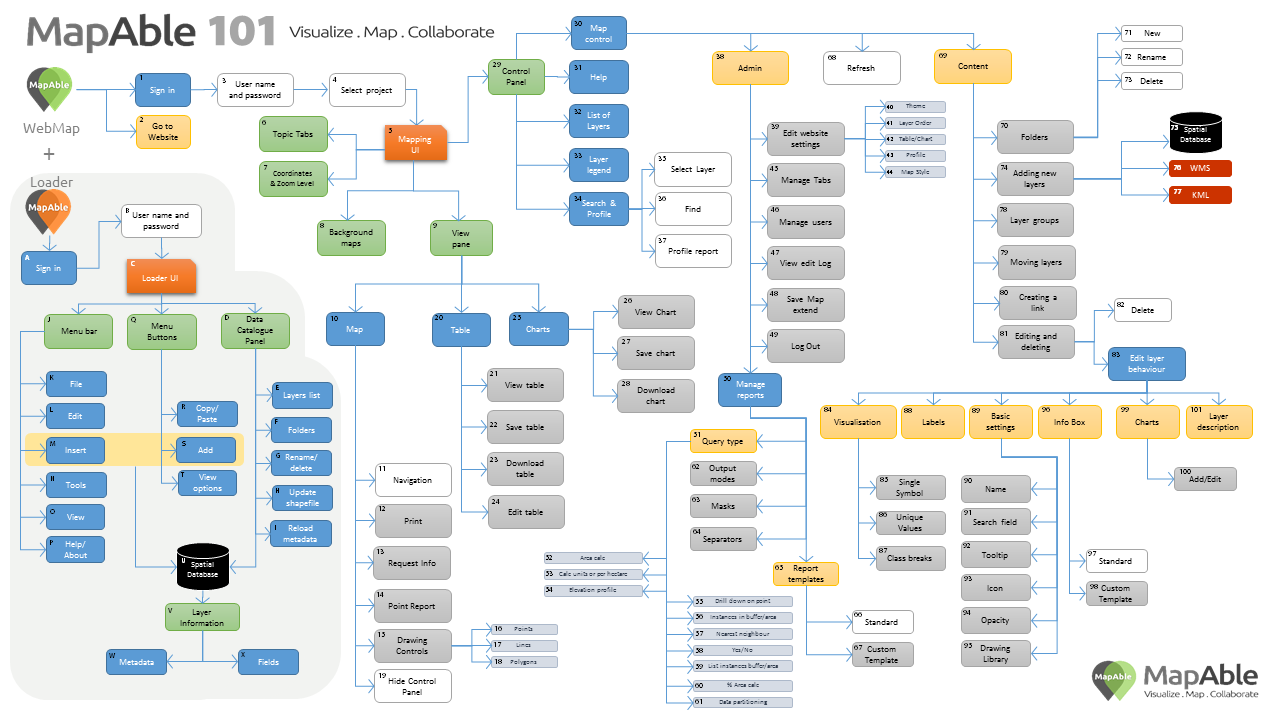
MapAble 101
1. Sign in form the MapAble Landing page
2. Go to website – user can choose to go to the MapAble website to view his subscriptions
3. User sign in with his unique name and password
4. Select MapAble workspace if more than one
The User Interface
5. Mapping User Interface where all mapping functions reside
6. Topic tabs where layers can be grouped by topics of users choice (See 44)
7. Area where coordinates in decimal degrees and zoom level are displayed
8. Choice of Background map services can be selected with buttons
The Map View
9. Map View Pane where the main information can be viewed
10. Map – displays the map in the View Pane
11. Navigation buttons which includes zoom, panning and reset zoom level
12. Print – user can print the map in the view extend on A4 and A3 sizes
13. Request info – Request info from MapAble or send a map to any other person via email by clicking on any location on the map. When receiver clicks on the link in the email message, the map opens up in his browser
14. Point report – Click anywhere on the map and select a report to be generated. Reports are set up in beforehand by user (See 49)
15. Drawing controls – user can draw freehand, point and polygons on the map an various colours, sizes and thickness and save the drawing for later use or distribute to others
16. Points – user can add various point with a choice of icons on the map
17. Lines – Polylines can be drawn by clicking various points in a linear direction
18. Polygons - Polygons can be added by clicking various points and closing the area
19. Hide control panel – Hide the control panel (See 29) if a bigger map area is required
Tables
20. Table – work with the attribute table of the selected layer (See 32)
21. View table – view the attributes in the View Panel as a table
22. Save table - user can save any changes being done in the attribute table (See 24)
23. Download table – The table can be downloaded as an Excel table
24. Edit table – user can edit or update any of the attributes in the table and then save it to the geo-database on the MapAble server (See 22)
Charts
25. Charts – a chart of selected attributes can be created
26. View charts – user can view attributes in chart format in the View Pane
27. Save chart - User can save the chart
28. Download chart – user can download an image file of the chart to add to reports or to accompany maps.
The Control Panel
29. Control panel – functions to control the behaviour and look and feel of MapAble. These functions will mostly be used by advanced users.
30. Map control – Various functions to control the behaviour of the layers and maps
31. Help – User can access the MapAble Helpfile which will be displayed in the View Pane
32. List of layers – All layers loaded in the workspace are listed on the left side of the map, from here the user can control the visualisation of each layer and switch them on/off
33. Legend – the legend of the active layer are displayed on the bottom left side of the map. The legend box can be minimised if needed.
34. Search and profile - The user can Search and Zoom to specific areas in a data layer (e.g. a Town or Ward). Once the area is selected, it can be used as a study area to base a report on (See 88)
35. Select Layer – Choose one of the searchable layers (See 88) to search for a place
36. Find – User type in the desired value and a list of all matches will be displayed. Once the user select the correct value, MapAble will zoom to that area.
37. Profile report – a selection of predefined reports based on the selected feature can be activated
Admin & Management
38. Admin – All the administration of the workspace can be administered from here.
39. Edit website settings – The look and feel of the whole application can be manipulated.
40. Theme – the colour scheme of the button bars and tabs can be selected
41. Layer order – The order in which layers display on top of each other can be selected between top-to-bottom and bottom-to-top.
42. Table/Chart – the functionality to view attribute tables and charts can be activated/de-activated.
43. Profile view – the functionality to create and view profiles and reports can be activated/de-activated.
44. Custom map style – the look and feel of the Google Maps® map service can be changed by the user.
45. Manage Tabs – The different topic tabs (See 6) can be added and edited. The order in which they are displayed can also be controlled here.
46. Manage Users – User profiles and rights can be created or deleted
47. View edit log – for use by the workspace administrator to view changes being done on the workspace by different users
48. Save map extend – the map extend on which the workspace will always open can be changed. This map extend is used when the “Reset Zoom” button is pressed. (See 11)
49. Log out – after working in MapAble, the user can log out of the session.
Analysis &Reports
50. Manage reports – Users can create analysis/query and report templates to create reports (see nr. 30) which can be used to compliment the maps.
51. Query types – Various locational queries can be performed using other related layers in the workspace
52. Area calc – calculate the hectares of a study area
53. Area calc units – calculate the hectares of a desired number of units that will fit in a study area. Unit calc per hectare – calculate the number of units of a desired size in hectares that will fit in a study area.
54. Elevation profile – draw a route and generate an elevation profile as a graphic
55. Drill down on point - get the value of another layer from a selected location or centroid of a study area
56. Instances in buffer/area – count the number of instances of another layer (e.g. Schools) from a buffer, centroid or border of a study area
57. Nearest neighbour – find the closest instance of another layer by means of Euclidean distance to the centroid or boundary of a study area.
58. Yes/No – Ask if there is an occurrence of another layer within the boundary of a study area and return a Yes or No as answer.
59. List instances in buffer/area – list the number of instances of another layer (e.g. Schools) from a buffer, centroid or border of a study area
60. % Area calc – calculate the percentage of area (e.g. land cover type) from one layer that forms part of the total area of a study area.
61. Area partitioning - doing data partition based on the weighted area of intersection to transfer data (e.g. Population figures) from one polygon layer to another polygon layer.
62. Output modes – user have several option of how the answer to a query should be displayed. This includes values only, custom sentences or charts.
63. Masks – user can determine how an answer to a query can be displayed if he selected the custom option in the output modes (See 61)
64. Separators – user can determine if an answer to a query can should be in sentence or list format (e.g. list of schools) if he/she selected the custom option in the output modes (See 61)
65. Report templates – the format and look and feel of the query results can be customised or a default style can be selected
66. Standard – This is the standard template in which a report based on the spatial queries can be displayed.
67. Custom template – users can create their own templates to display the query results with any software package that can export to html format. The easiest and most popular software with which to do it in, is Microsoft Word®
68. Refresh – refreshes the map and reload all the layers in the View Pane
Spatial Data
69. Content –A range of tools and functions to add, edit and visualise spatial data in MapAble
70. Folders – Layers can be managed by use of folders in the list of layers (see 32)
71. New – Create a new folder and give it an appropriate name
72. Rename – Any folder can be renamed and it will automatically be updated to all user profiles
73. Delete – If a layer becomes redundant, it can be deleted
74. Adding new layers – There are various ways and format with which a user can add a new layer to the map
75. Spatial Database – This is where all the MapAble public domain layers and the client specific data is hosted. (See MapAble Loader) Geo-referenced raster imagery and scanned maps can also be added to the map view
76. WMS – Web map services are available from some data service providers. MapAble is WMS ready and services can be loaded into the map view where available.
77. KML – Files created in Google Earth can be added to the map view
78. Layer groups – A layer group can be used in two different ways. It can be used to create a dynamic layer of a selection of layers (e.g. Towns and their labels) or it can be used to view layers residing in another Topic Tab (see 39)
79. Moving layers – the order of the layers can be changed by moving them up or down.
80. Creating a link – a URL link of the map as displayed on the screen can be created and send via email to another group member.
81. Editing and deleting – MapAble offers a range of tools to edit the look and feel and behaviour of data layers
82. Delete – A data layer can be deleted from the Map View without removing it from the Spatial-Database (See MapAble loader)
Visualisation
83. Edit layer behaviour – The behaviour of a layer can be manipulated in MapAble to create well designed maps
84. Visualisation – The look and feel of a layer can be manipulated to be viewed in a desired way
85. Single symbol – When a single colour or icon is desired.
86. Unique values – when qualitative features need to be differentiated on the map (e.g. Provinces and School types)
87. Class breaks – when quantitative values need to be classified into ranges (e.g. Population density or Income)
88. Labels – When selecting an appropriate column in the attribute table, labels can be added to any layer in the map.
89. Basic settings – to differentiate between different layers, some basic settings can be done
90. Name – A descriptive name to be displayed in the List of Layers
91. Search field – A selected column from the attribute table to assist in navigating or finding a location. (See 34)
92. Tooltip – The value in a selected column can be displayed when the user hovers the mouse arrow over the feature in the map.
93. Icon – An icon to identify the specific layer in the List of Layers. Custom icons can be uploaded to MapAble.
94. Opacity – The opacity of all the features of the layers can be set from High (255) to Low (0)
95. Drawing library – Some non-standard shapefiles uploaded to the Spatial-database may have some rendering issues like spikes. This can partly be fixed by selecting a different renderer for the layer.
96. Info box – The attributes of each feature in a spatial layer can be displayed when the user click on the specific feature on the map.
97. Standard template – MapAble will create a standard info box in which attributes will be displayed. The user can select which attributes should be displayed. Custom name (aliases) can also be added.
98. Custom template - users can create their own templates to display the attributes with any software package that can export to html format. The easiest and most popular software with which to do it, is Microsoft Word®
99. Charts – Basic pie and bar charts can be displayed using the values of the attribute table (See 25)
100. Add chart – More than one chart can be created from the same layer.Edit chart – editing of an existing chart can always be done when required.
101. Layer description – a description of the contents and usability of the layer.
Loader ABC
A. Sign in – after starting the desktop application. The user can sign in from the MapAble Loader login box
B. User name and password - User sign in with his unique name and password
C. Loader user interface – where all the data management and uploading functions reside
D. Data catalogue panel – A directory style list of all the subscribed workspaces of the specific user appear on the left panel
E. List of layers – All the uploaded layers related to each workspace is listed in a directory style on the right panel
F. Folders – on right click, a new folder can be added in the directory structure.
G. Rename/delete – on right click, a layer or folder can be renamed or deleted from the spatial database
H. Update shapefile – on right-click, a current shapefile can be updated by uploading a newer version of the shapefile in its position in the spatial database.
I. Reload metadata – on right click, a XML styled metadata file can be uploaded to update the layers metadata properties.
J. Menu bar – Tools to activate functions can be accessed from the menu bar.
K. File – user can create a new folder or exit the program from the file dropdown list
L. Edit – user can delete current folder and layers from the spatial database from the Edit dropdown list.
M. Insert – An ESRI shapefile can be added to the spatial database from the Insert dropdown list.
N. Tools – The speed at which uploads will happen can be set under Options in the dropdown list
O. View – the Status bar can be switched on or off in the dropdown list.
P. Help – Access to the Help file and the “About” page of MapAble Loader can be accessed from the Help dropdown menu.
Q. Button bar – Some standard functions can be accessed from the button bar
R. Copy/Cut/Paste – Normal copy/cut/paste functions to manipulate files.
S. Add - An ESRI shapefile can be added to the spatial database
T. View options – the way the directory tree displays on the screen van be changed.
Spatial Database
U. List of layers – a list of all the layers already loaded into the spatial database.
V. Layer information – after double clicking on a layer, descriptive information specific to each layer are displayed to assist in data discovery
W. Metadata – Standardised metadata about each layer to describe the nature, age, distribution and custodians of the layer.
X. Fields – a description of the content of each field in the attribute table of the layer.