Chart mode
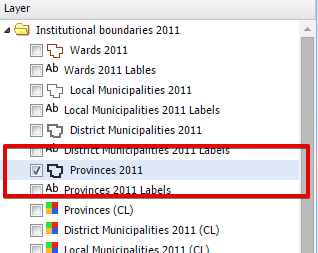
A pre-defined chart or series of charts of any of the layers displayed in the layer list can be displayed in the view pane. To be able to display a chart a layer needs to be selected in the layer list.
Once the layer is selected it will be colored in a blue band:
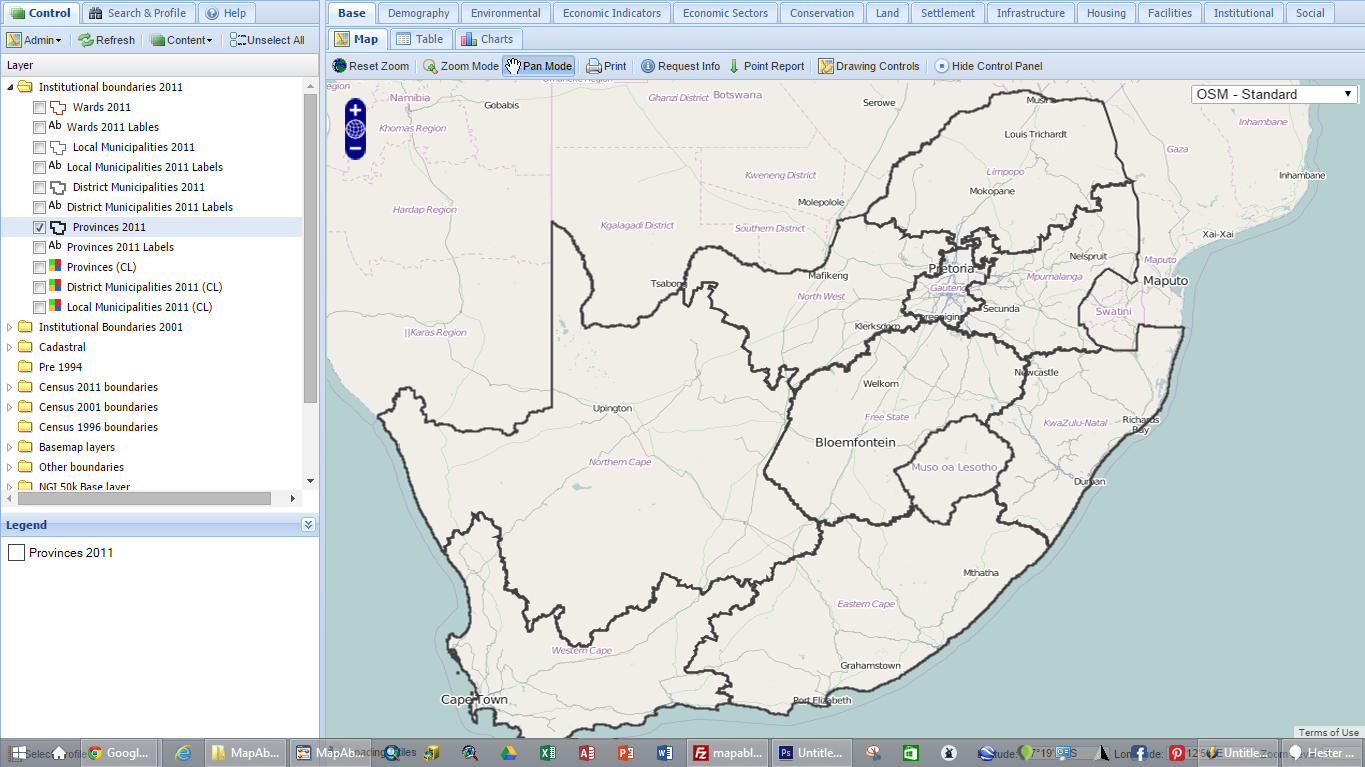
The viewpane will show the specific map:
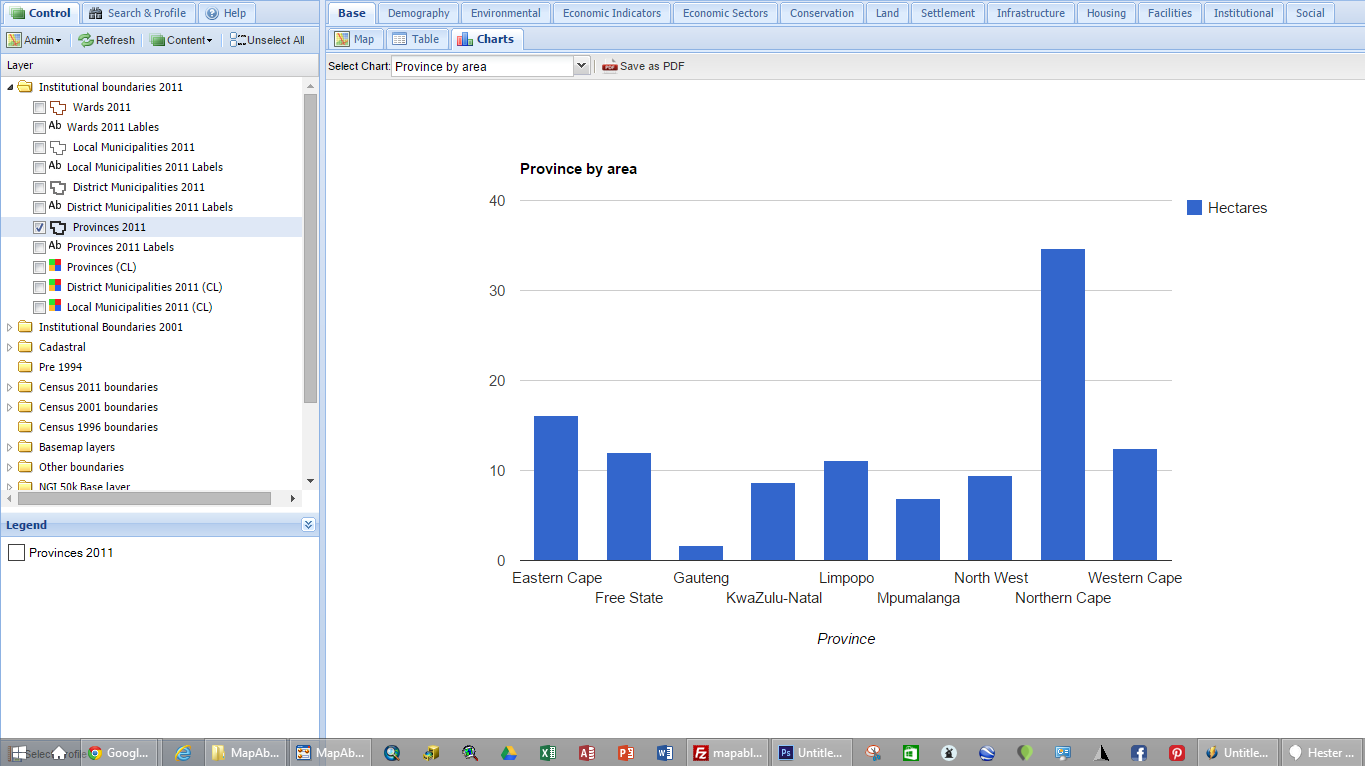
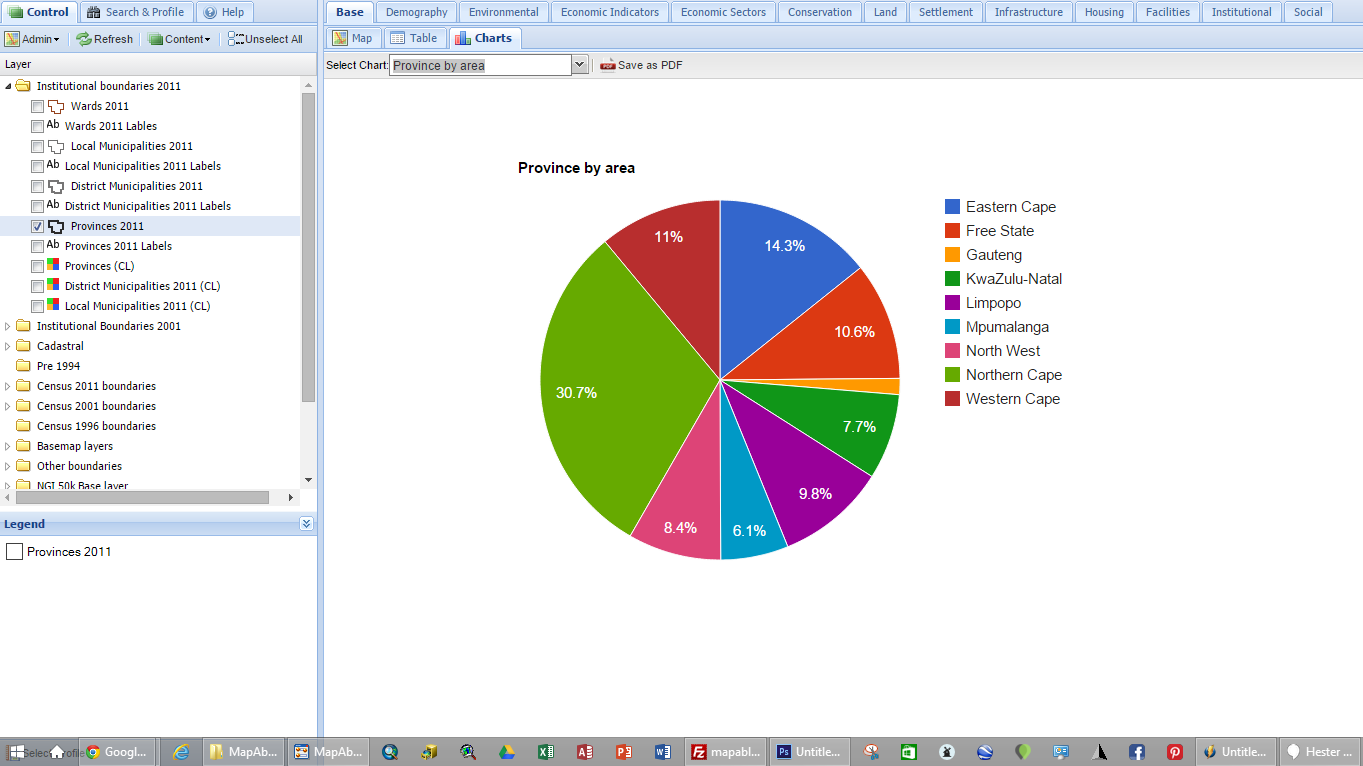
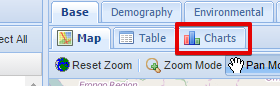
To show the selected layer's pre-defined charts, select the "Charts" button.
The chart of the selected data layer will now be shown in the view pane. This is how it will look: