Table mode
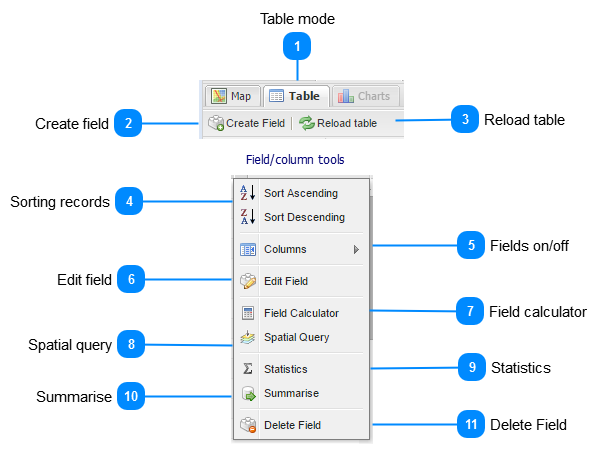
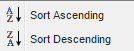
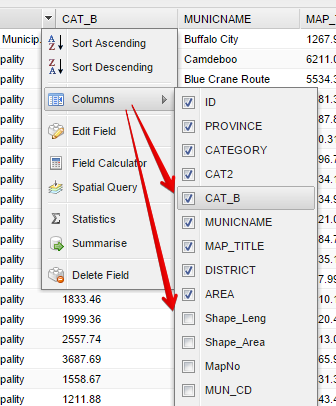
Please note: To access the Field Column tools, the user should select a specific field in the table and click on the dropdown arrow at the right of the field name:
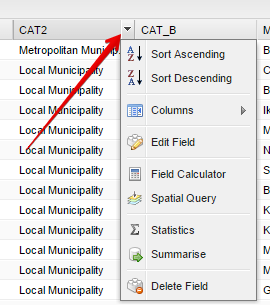
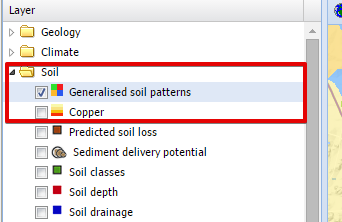
Table modeAn attribute table of any of the layers displayed in the layer list can be displayed in the view pane. To be able to display a table a layer needs to be selected in the layer list.
Once the layer is selected it will be colored in a blue band:
 The viewpane will show the specific map:
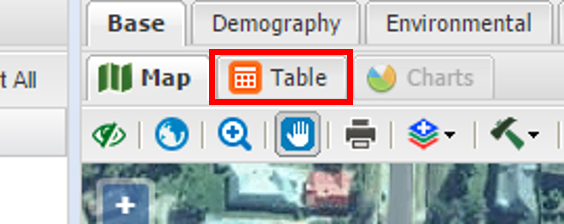
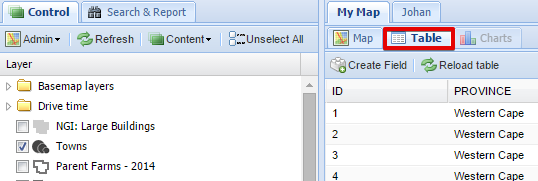
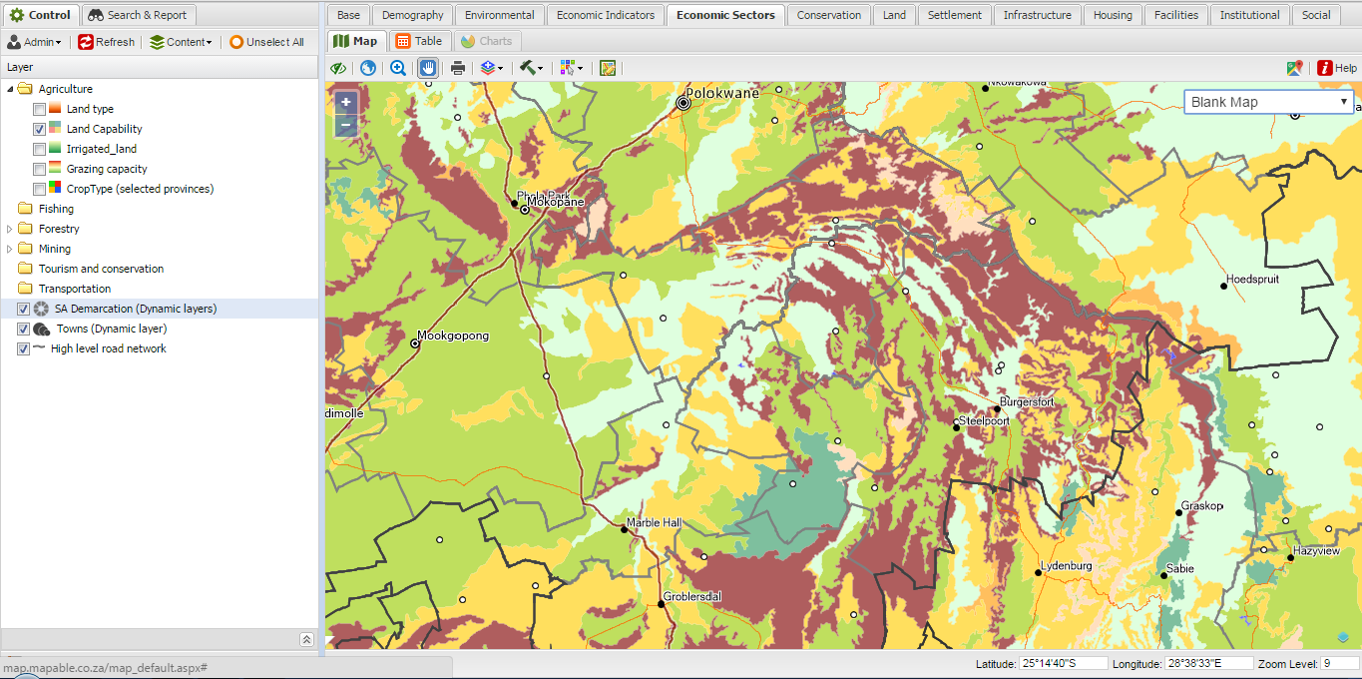 To show the selected layer's attribute table, select the "Table" button.
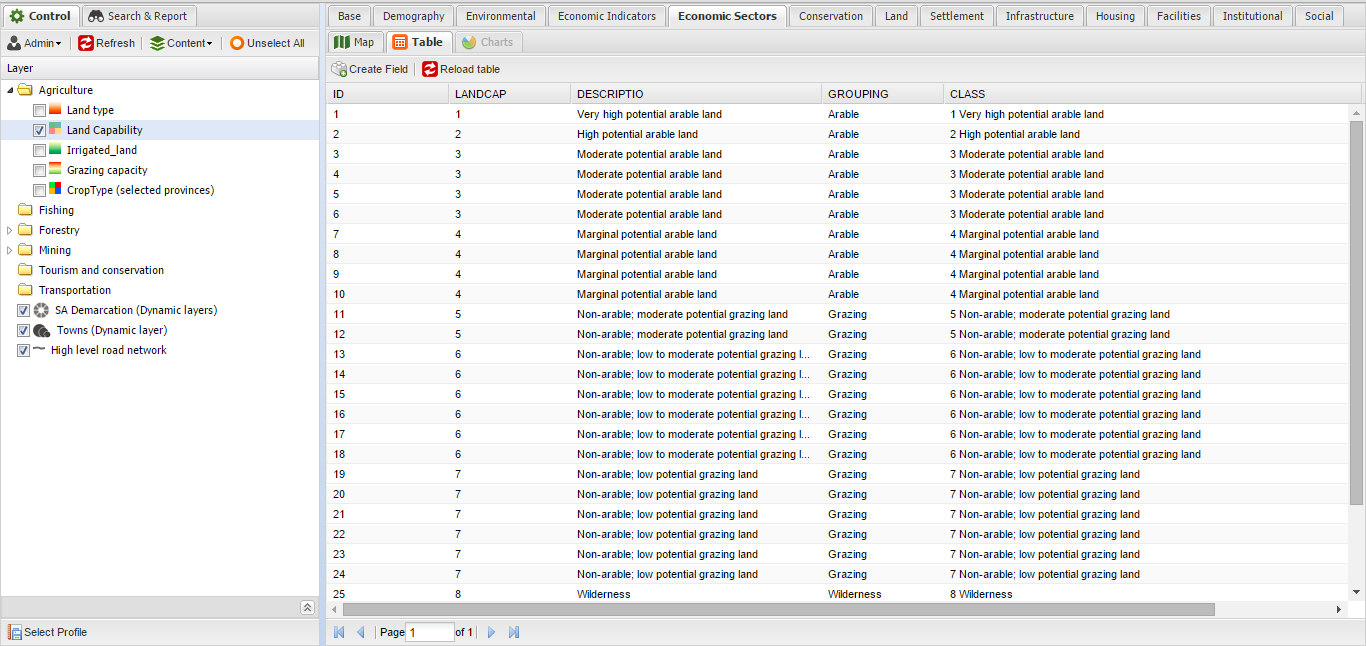
 The attribute table of the selected data layer will now be shown in the view pane. This is how it will look:
 |
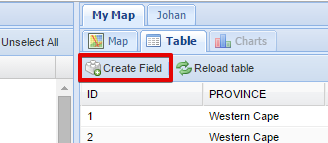
Create fieldTo add new data to an existing table, the user will need to create a new field. The following section explains how to create a new field in the table:
After highlighting the appropriate layer in the List of Layers, goto the Table mode to display the attribute table of the layer.
 A sub-menu will appear where the user can select the "Create Field" menu item:
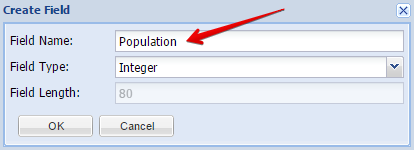
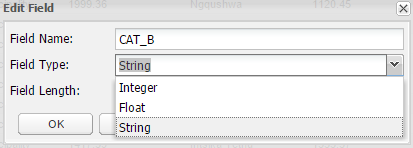
 A new dialog box will appear where the user needs to specify the name and type of field to be created. The user can first add the new field name:
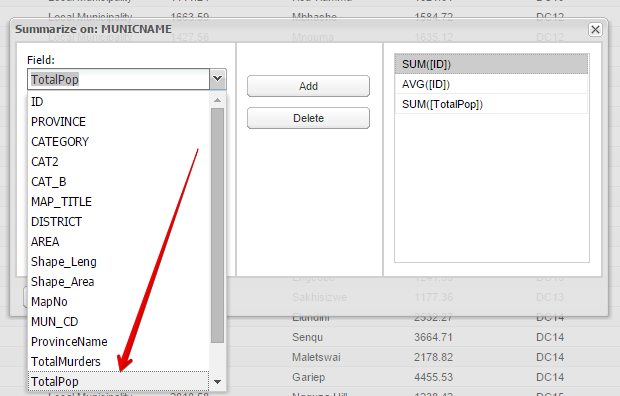
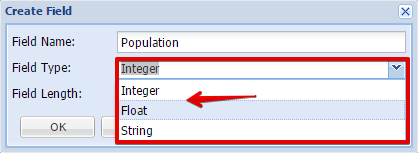
 The field type needs to be selected from a dropdown box. There are three types of fields to be created:
The user can now select the appropriate field type
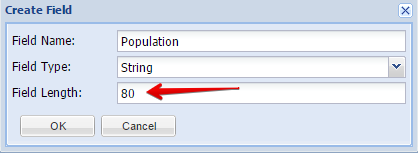
 Next the field length needs to be defined. The default value is 80 characters but can be changed if required.
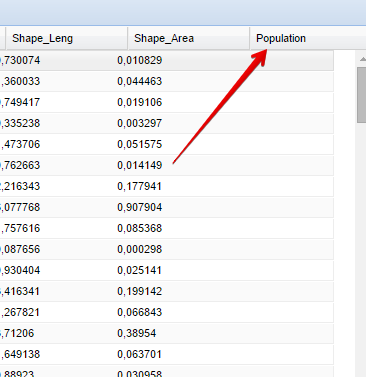
 After clicking on the OK button, the new field will be added in the attribute table
 The next step is to populate the field with data with either the Field Calculator or the Spatial Analysis Tools.
|
Please note: To access the Field Column tools, the user should select a specific field in the table and click on the dropdown arrow at the right of the field name:
Field calculatorThe Field Calculator is used for copying fields, concatenating (i.e., combining) strings, performing most mathematical calculations, and entering raw data. The Field Calculator can be used for conditional reclassification, complex mathematical calculations, and extracting geometric and geographic information.
The Field Calculator is used to construct SQL expressions to do calculations based on either the Geometry or the current attributes of the selected layer. By using a combination of Fields, Operators and Functions, an SQL expression can be build to do a specific calculation. It also allow the user to do general attribute management of the values in each field (e.g. to round a number or split text string in portions)
For a detailed description on how to use the Field Calculator, please refer to the Field Calculator section under Data Fusion
|
Spatial queryThe Spatial Analysis Toolbox is exactly the same as the Spatial Analysis Toolbox for Spatial Report and can be used in the same way. The only difference is that the result will be permanently added to the selected field in the attribute table of the selected layer and added to the spatial database.
For a detailed description on how to use the Spatial Query tool, please refer to the Spatial Query section under Data Fusion
|