Output modes and charts
Different type of queries generate different values. Sometimes only one value is calculated, sometimes two values form part of the output (e.g. Nearest neighbour can list the name and distance of feature).
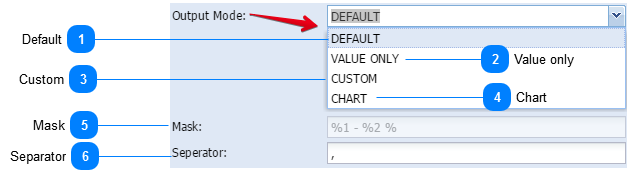
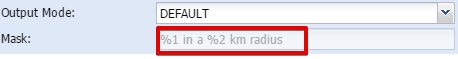
The answers are always indicated by a %1 and %2 in the mask.
|
The two codes for values are:
|
|
%1 = the name of an entity (e.g.. grasslands or name of school)
|
|
%2 = the amount (e.g. amount of kilometres, or number of schools)
|
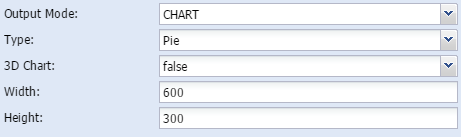
Depending on the type of query, different output modes can be set:
ChartWhen the user is intersecting two layers and calculating the proportion of the parts per type, the result can be shown in a chart:
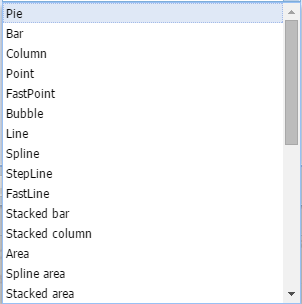
Types of charts:
Various types of charts can be generated.
 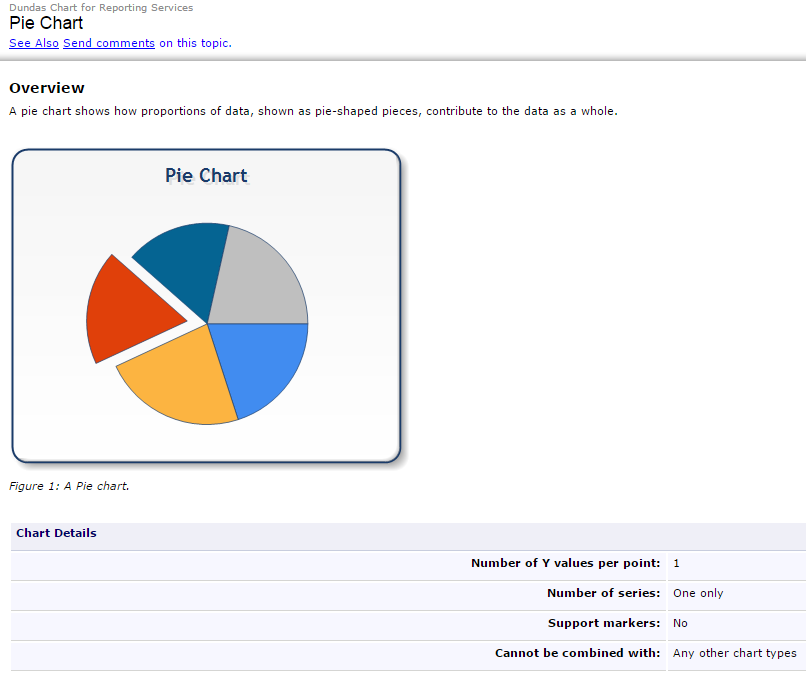 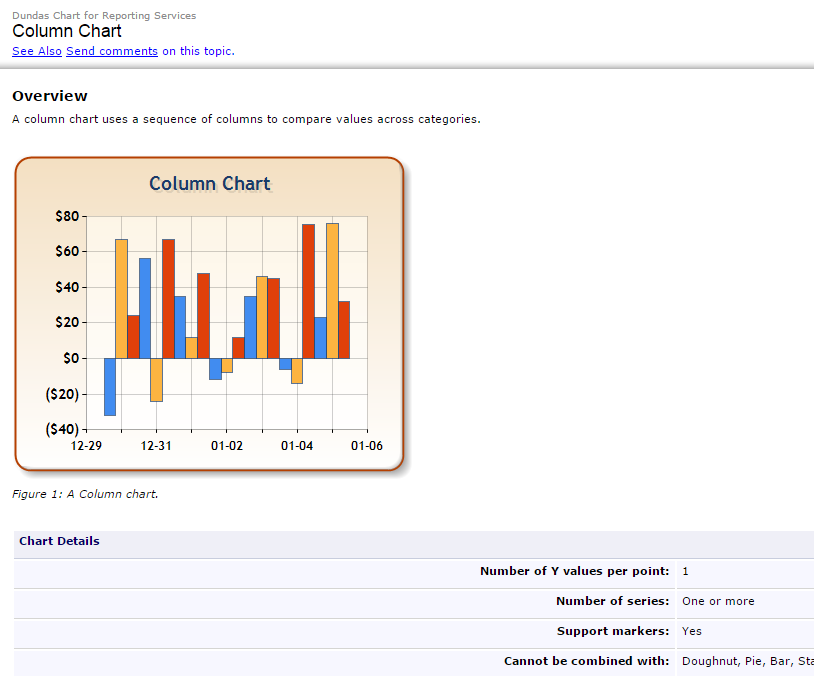 To have a description of the charts, please go to the following websites:
When to use a chart:
The chart functionality is specifically designed to work with the % area calc tool. It is not advisable to use with any of the other analysis tools.
|
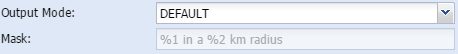
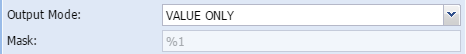
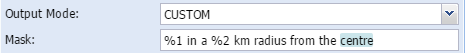
MaskThe Mask shows how the output is constructed. When in Custom mode, the mask can also be edited to add additional text. Here is an example:
In default mode:
 |