Query Toolbox
<TODO>: Insert description text here... And don't forget to add keyword for this topic
|
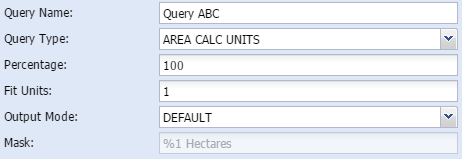
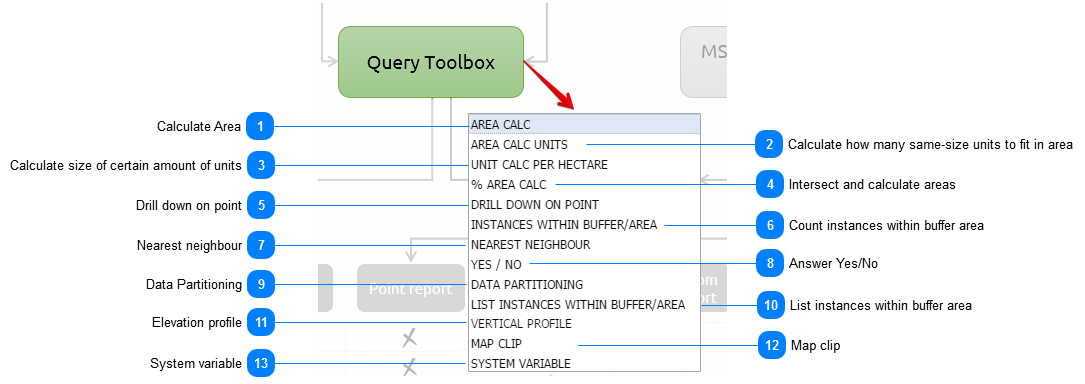
Area calc is a simple calculation of the total area of the study area in hectares.
In addition the user can either calc the total area of the study area or a portion of the area. In the parameters field the user can type in what percentage of the site the area should be calculated on.
| ||||
|
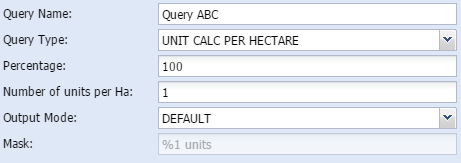
This method assist the user to calculate the average size of parts if it is to be split in a certain amount of parts. Yet again, the user can do the calculation on only a certain percentage of the total study area as well.
| ||
|
With this method, the user can calculate how many units will fit in the study area if it is to be of a certain size. The user can do the calculation on only a certain percentage of the total study area or the full area.
| ||
|
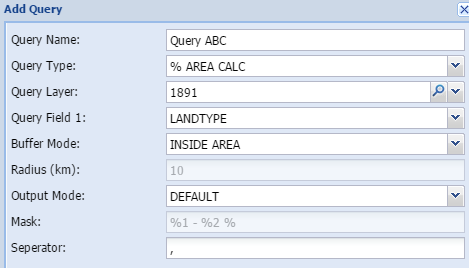
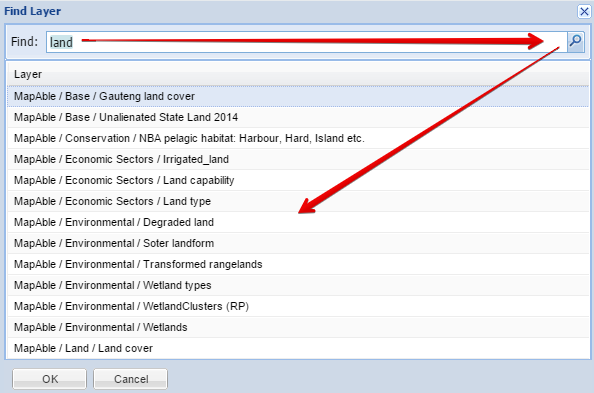
The percentage area calculation tool intersects the study area with a chosen theme and calculate the percentage of each part of the chosen theme which intersects the study area.
| ||
|
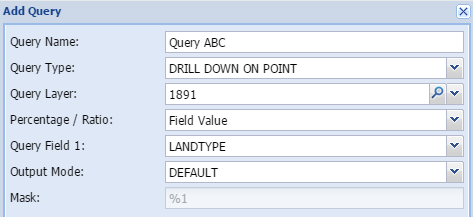
Drill down on point is a simple overlay analysis based on the point of the centroid of the study area. If a polygon is used as the study area, the tool calculates the centroid of the polygon and establish the value of the specified layer at that specific point. It then reports on it.
| ||
|
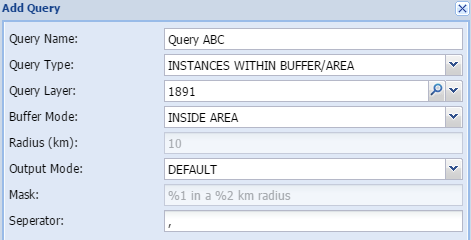
This tool calculates the number of instances of another layer that can be found within a specified distance from the study area.
| ||
|
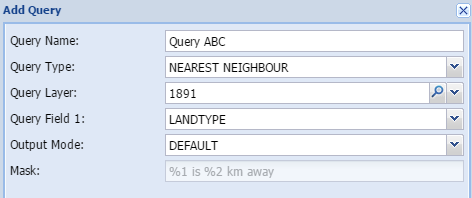
The nearest neighbour calculation will determine the nearest instance of the specified layer. It will report on it by indicating the distance in kilometre and indicating the name
| ||
|
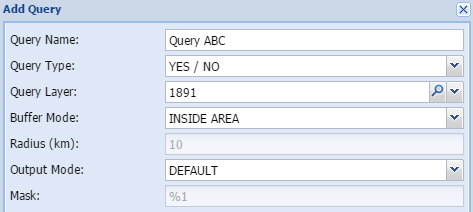
The YES/NO method does a quick check by means of an intersection, and simply reports on the presence of a specific entity that are present on the property. The answer is either YES or NO.
| ||
|
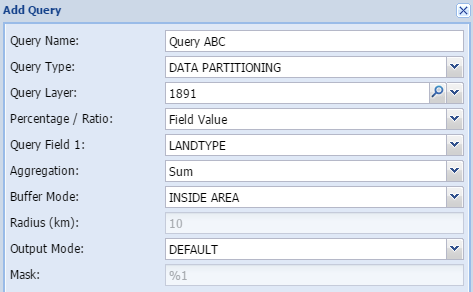
Data partitioning can be used to calculate demographic or other data proportionately based on another polygon theme. For example, people often need information on census demographics for areas that are not coincident with the census boundaries themselves, things like catchment areas or service areas. This tool makes that process easy. The proportions are based on the area of the intersecting themes.
| ||
|
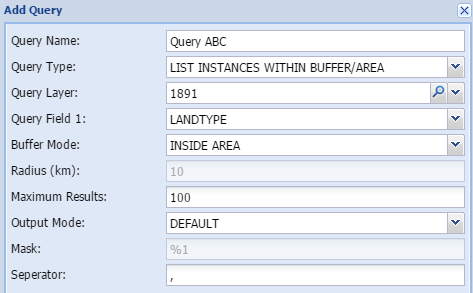
This tool does exactly the same as the Instances within buffer zone, except that it does not count them but list them. This is very handy if you need to know the names of the objects you are studying.
| ||
|
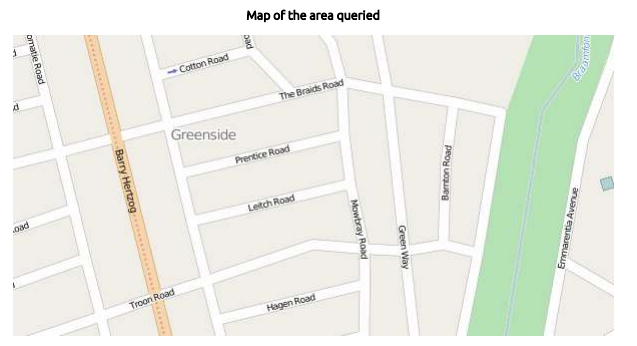
A clip of the study area can be added to the report.
| ||
|
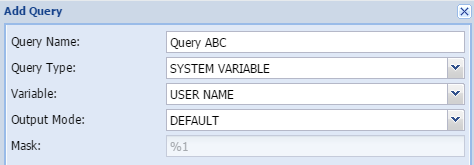
Additional variables can be added to assist with administration and versioning of reports
| ||


