Thematic visualisation
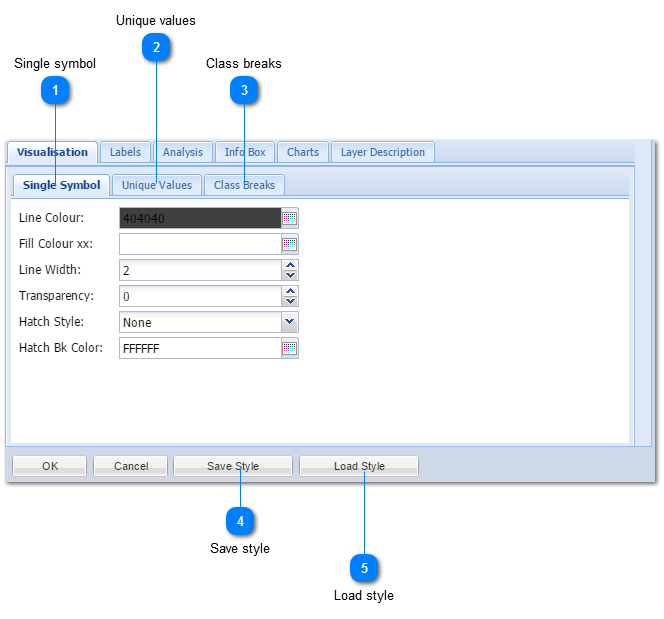
Thematic visualisation is the way in which a data layer is displayed on a map. There are many ways of visualisation. MapAble offers the user three different ways of displaying data in the View Pane.
|
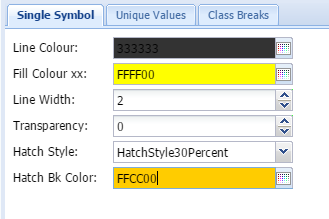
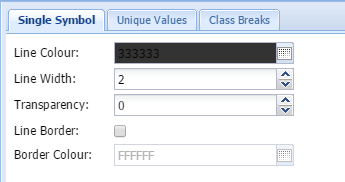
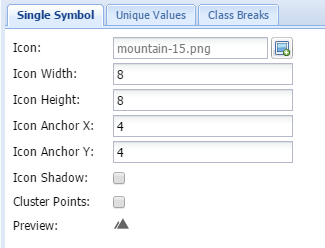
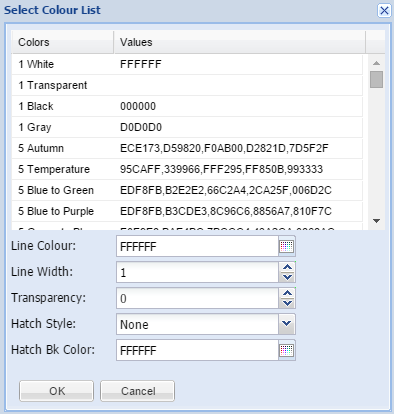
The Single Symbol is the most simple way of displaying a layer. Only one foreground color and one outline color are used to display a layer. Different toolsets are available for different polygon types. The following tools will assist the user to prepare a single symbol layer:
| |||||||||
|
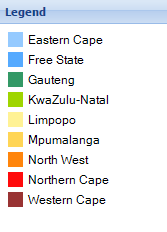
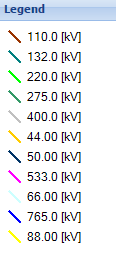
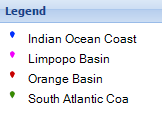
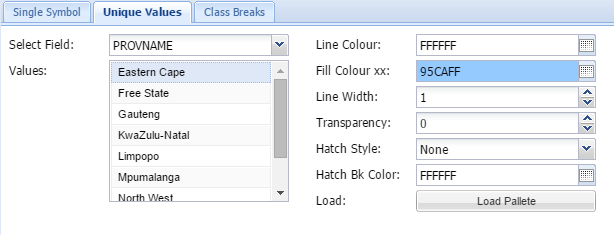
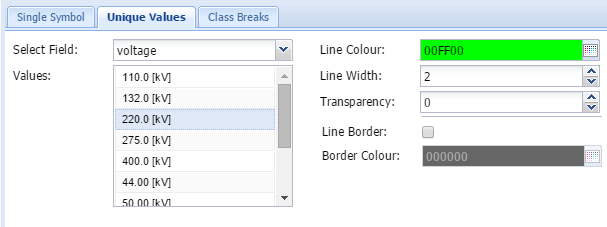
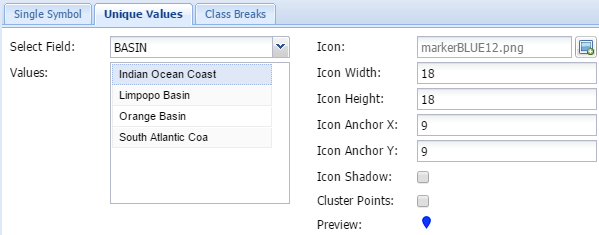
Unique values are applied when data layers have a number of explicit classes (e.g. Province names, Geological types). Different toolsets are available for different polygon types. The following tools will assist the user to prepare a unique value layer:
| ||||||||||||
|
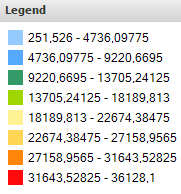
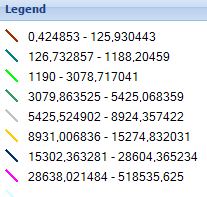
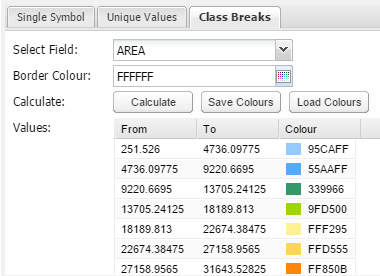
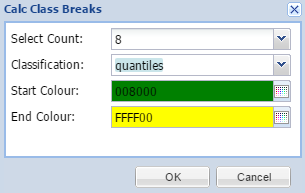
When mapping quantities, it is normally better to classify them in classes. When you classify your data, you can use two standard classification methods provided in MapAble, or you can manually define your own custom class ranges. This topic describes these classification methods:
| ||||||||

