×
Menu

Map mode

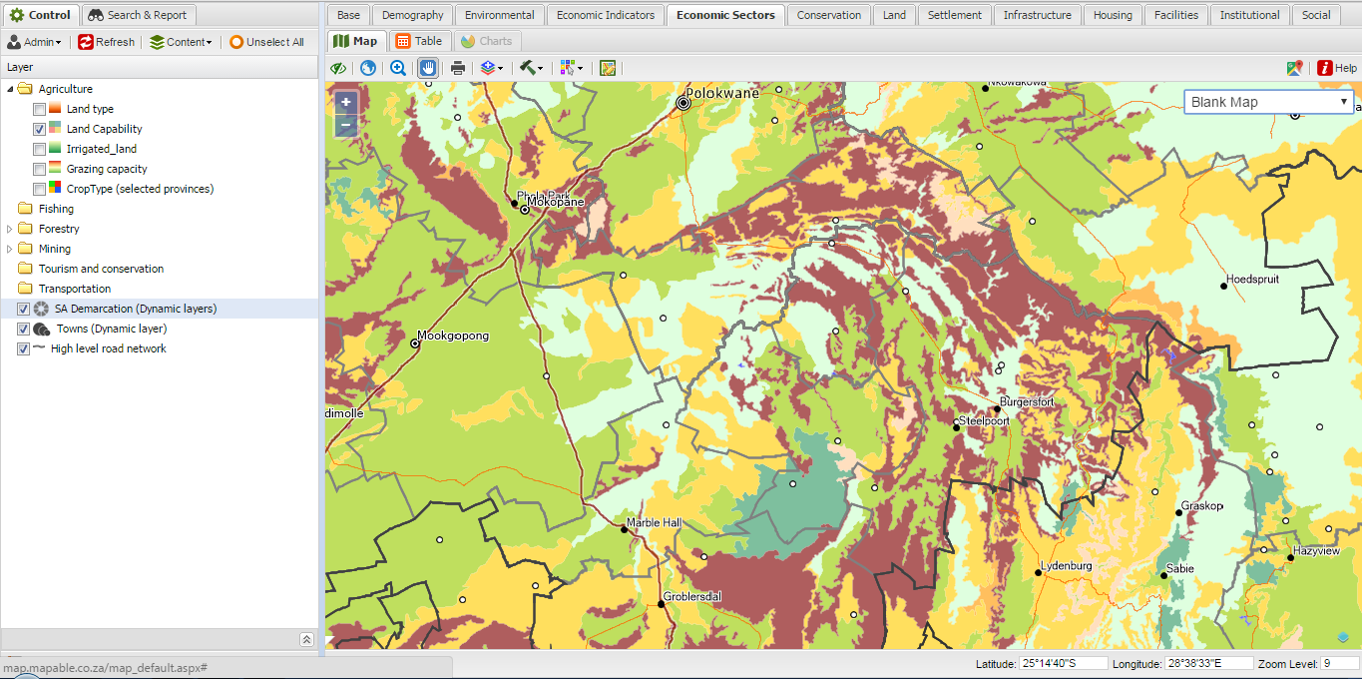
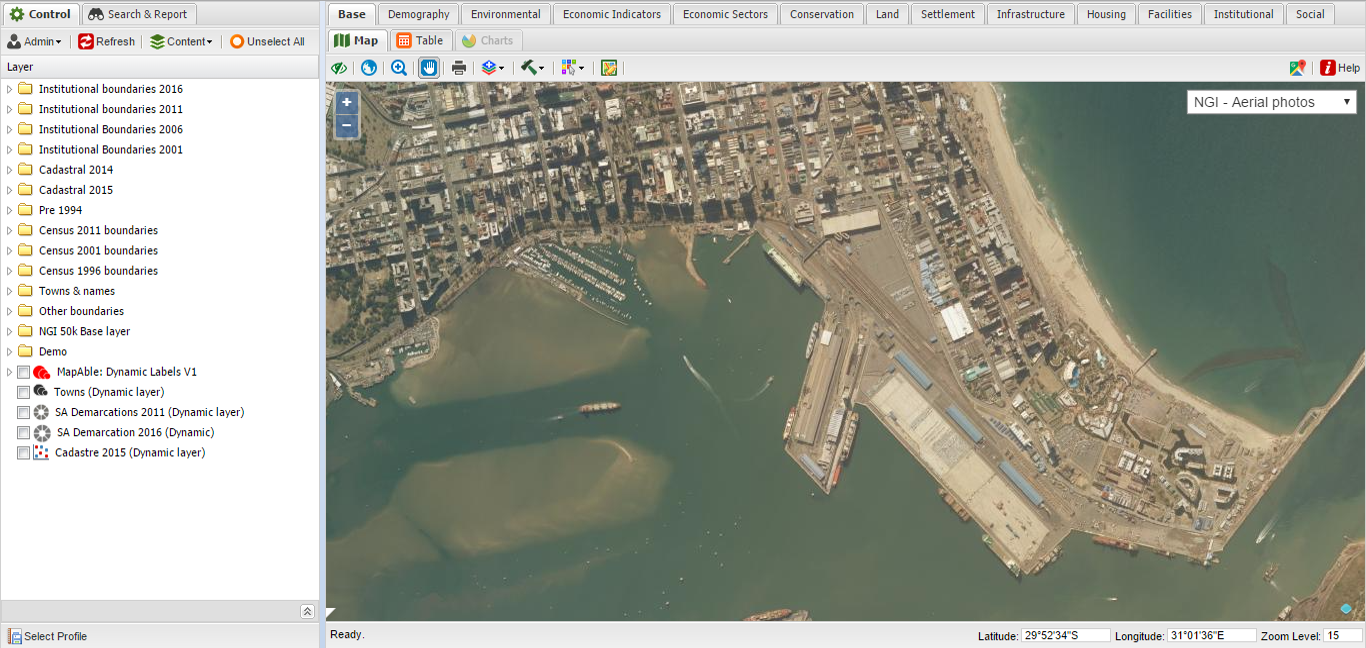
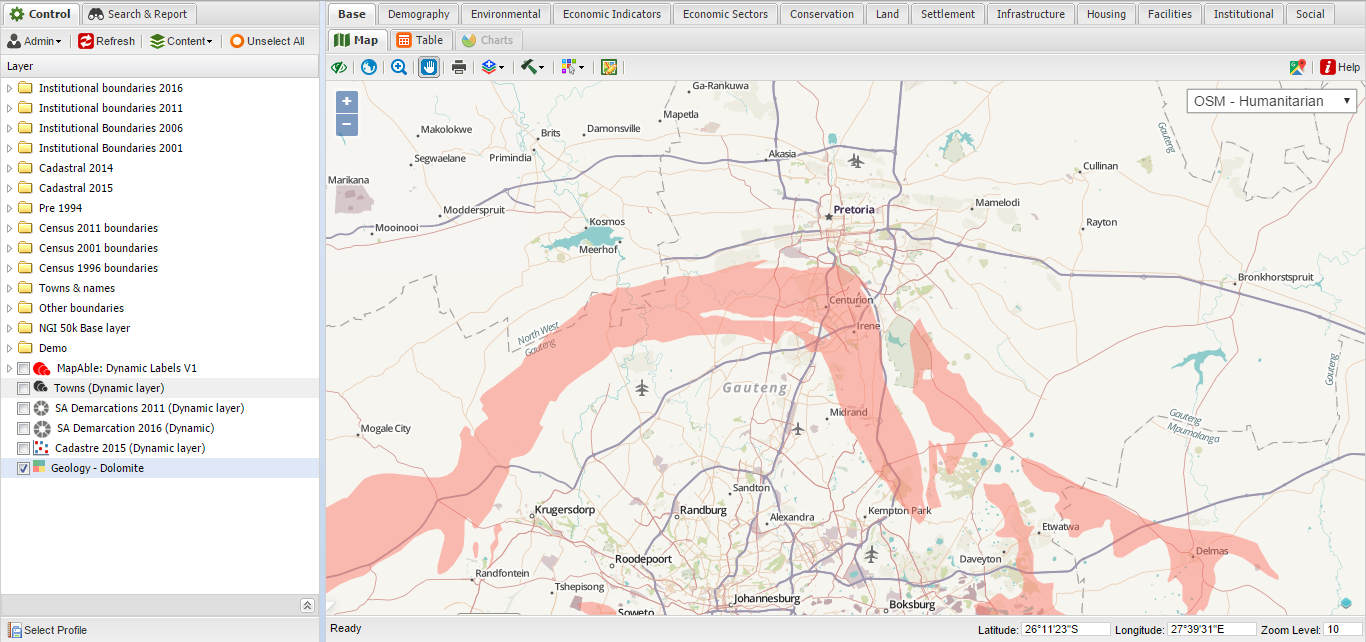
The map mode is the default mode in the View Pane.  Once the user have selected layers in the layers list,  it will be displayed in the view pane.
 
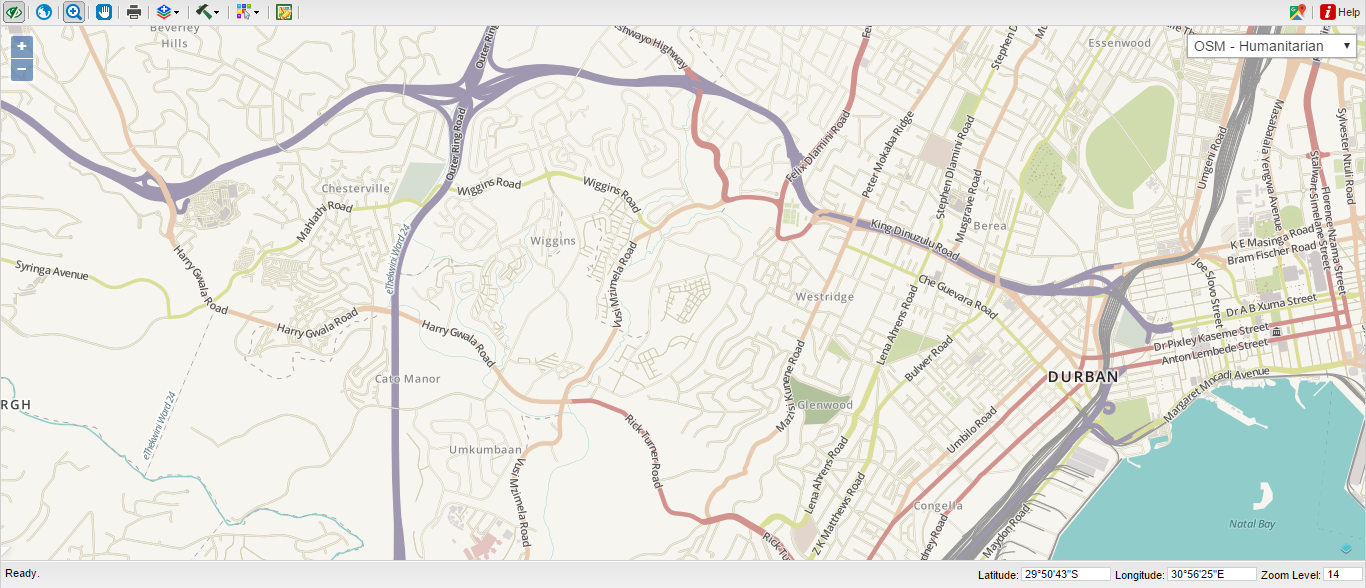
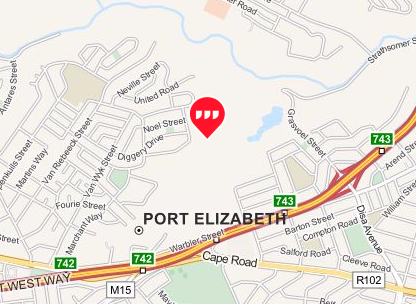
A typical map of a selection of layers will look like this example:
 
 
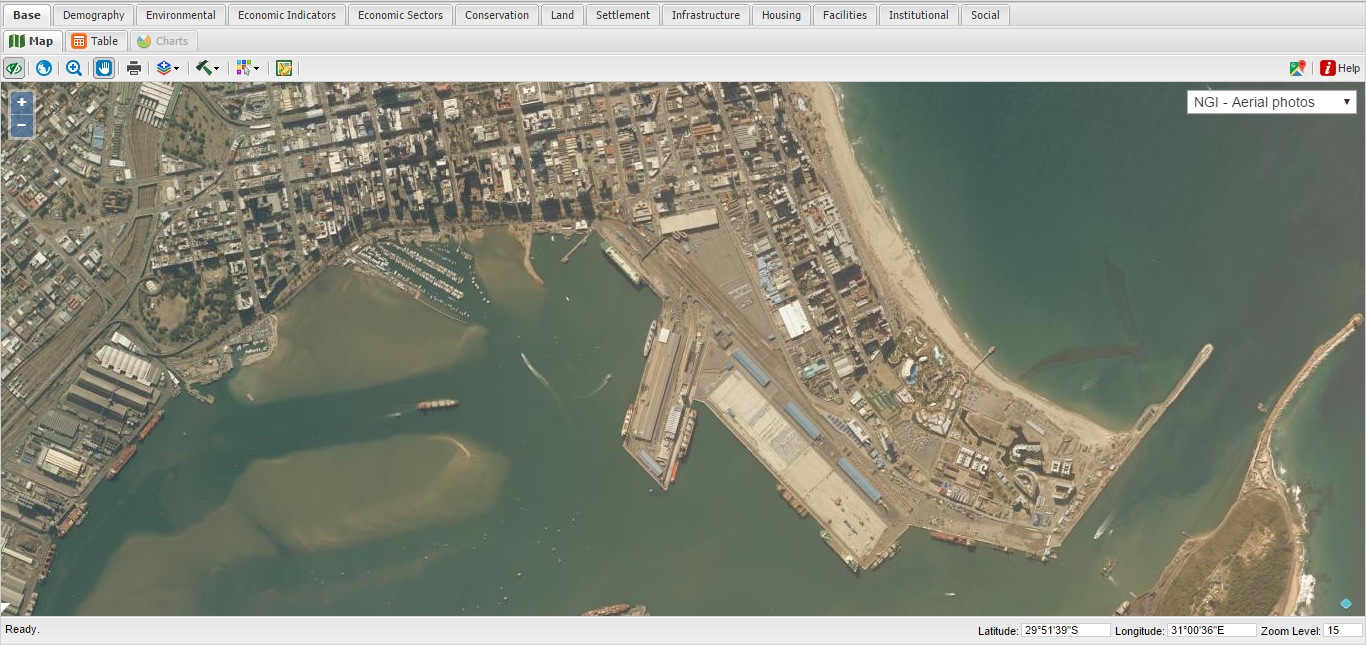
Once the desired layers are displayed in the map, the user have a range of tools to work with.  The following menus will appear once the view pane is in the map mode:
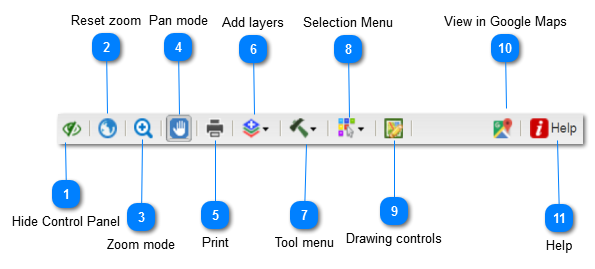
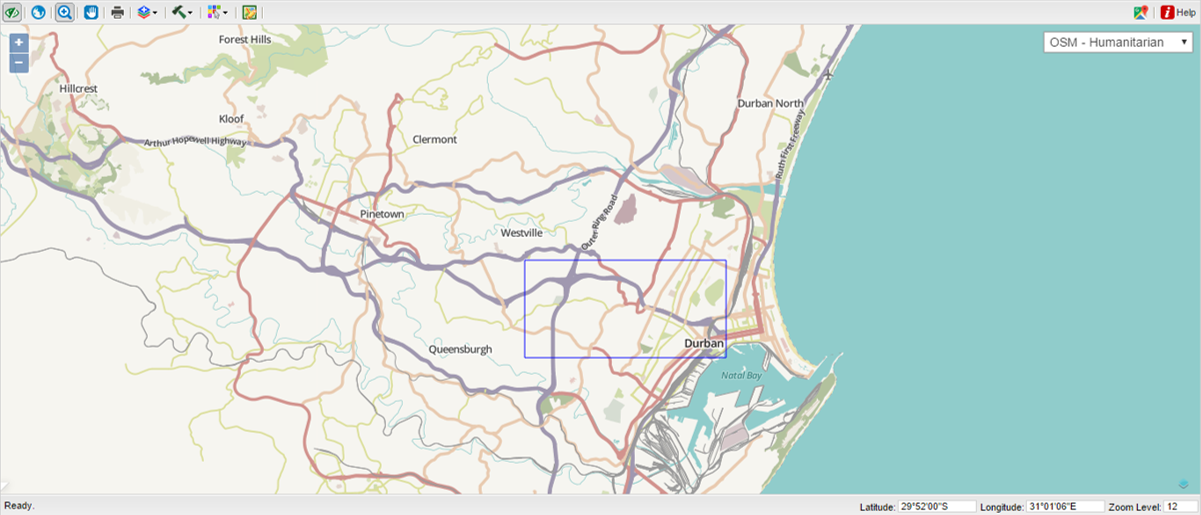


Map mode
 
1

Hide Control Panel

1. Hide Control Panel
The Hide Control panel lets the user remove all the controls on the left hand side of the view pane in order to increase the area of the map.
 
The following two images illustrate the difference between a visible and removed Control panel:
 
Visible control panel
 
Removed control panel.
 
When the user needs to use the control panel again, the Show Control Panel button (which replaced the Remove Control Panel button) can be clicked.
 
 
2

Reset zoom

2. Reset zoom
The Reset Zoom button gives the user the function to zoom back to the default View Extend of the workspace. The default View Extend is discussed here in more detail.
3

Zoom mode

3. Zoom mode
The mapping API has a set of standard navigation tools that look like this:
 
 
Apart from the standard zoom and navigation tools in the map API, an additional zoom tool is added in MapAble to ease the process of zooming into an area. Once the button is activated, the user can draw a rectangle over the area of the map to zoom to.
 
 
And the map display will move the selected area:
 
4

Pan mode

4. Pan mode
The user can move in any direction with the pan tool.  Once the map is in pan mode, the user can click anywhere in the map and use the mouse to move the map to the desired position.
5

Print

5. Print
The current view in the map can be printed by clicking the Print button.  Once the print button is clicked, the following dialog box appears including a print preview:
 
 
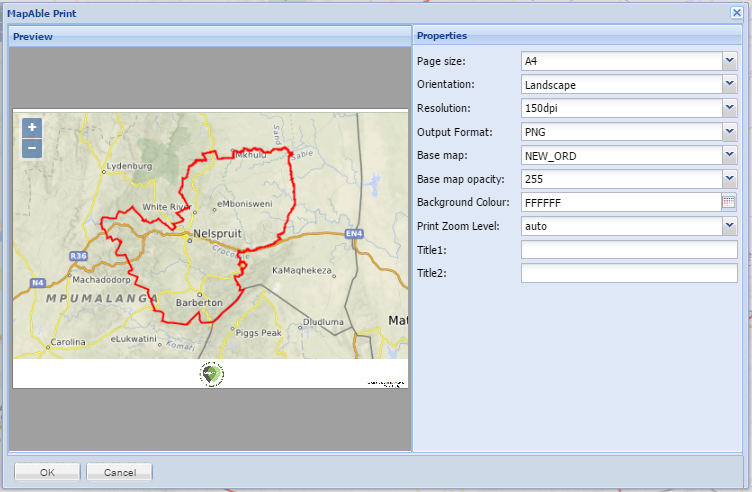
The MapAble® printbox displays a print preview screen that automatically displays the area the user selected to print. However, the user can adjust the area to print by click and dragging to the desired print area (see pan mode) as well as adjusting the zoom level.
 
The user can then make a couple of choices:
 
Page size
A4 to A0
Orientation
Landscape of Portrait
Resolution
75dpi, 150dpi or 300dpi
Output Format
PNG or PDF
Base map
Which base map  to be displayed in the background. Other base maps can be chosen from the list.
Base map opacity
The opacity of the base map (0 = fully transparent)
Background Colour
The user can change the background colour if the Black background map is selected.
Print Zoom Level
Adjust to preset zoom levels (auto zoom level selected as standard)
Title 1
User can add a title to the map (Optional)
Title 2
Use can add a subtitle to the map (Optional)
 
When the desired choices were made, the user can click the OK button to activate the printing process.
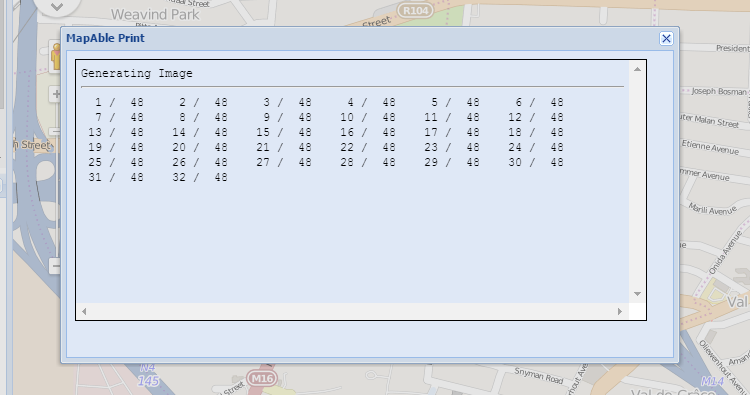
The following dialog box will show the progress of the printing process:
 
 
Please note: 
The printing all happens on the server to ensure the best map quality.  The process involves the zooming in to the area to create high quality tiles.  The exact zoom level as seen on the screen may not be exactly the same size as the printed version (although you can adjust the zoom level in the print preview mode).  If the user need another zoom level,  please try different level and do the printing until satisfied.
 
Once all the tiles were created on the server.  It will assemble the map as well as a legend and give the user the option to download with the following dialog box:
 
 
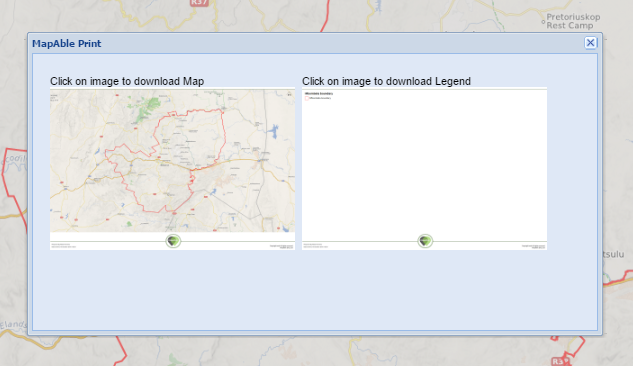
The user can now download the files and print them on a printer. The final map will typically look like this next example:
 
 
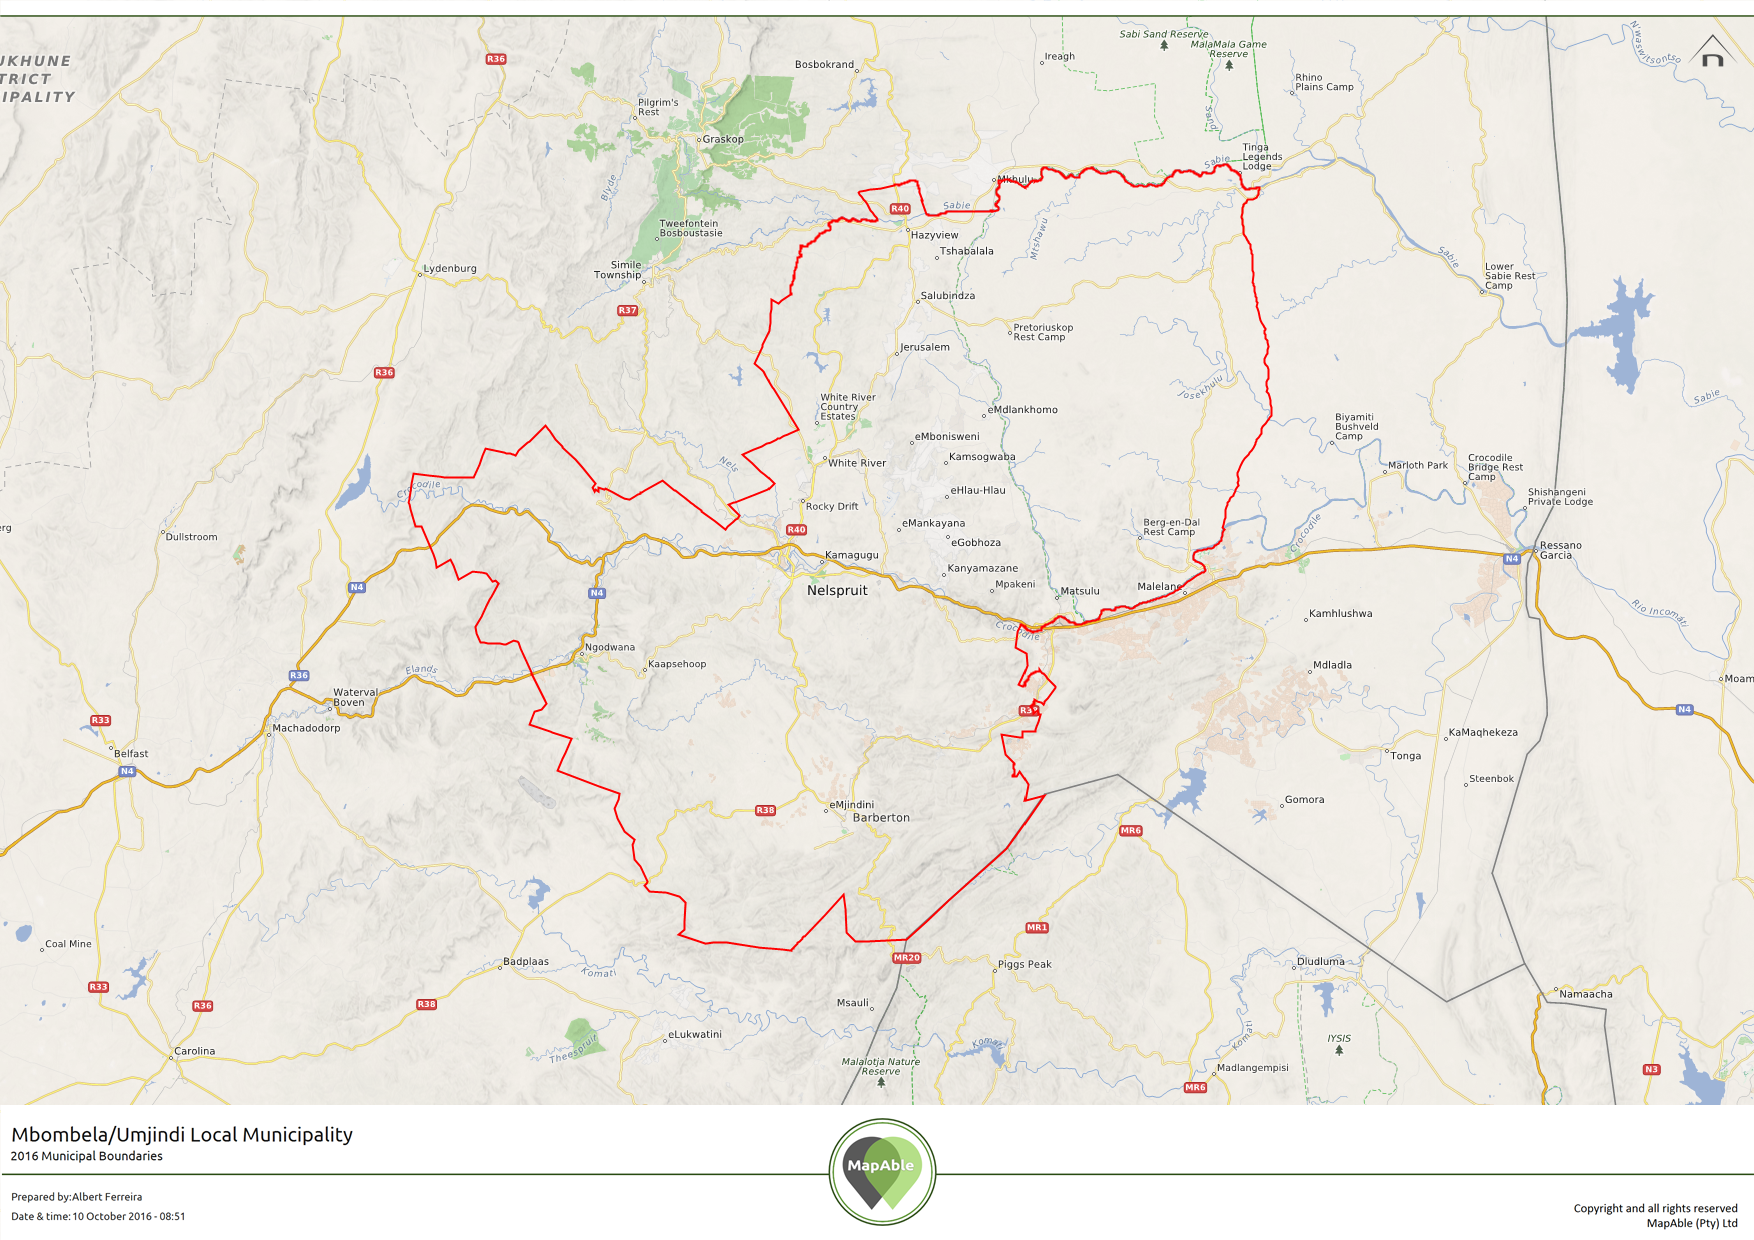
The information added to the map will look like the following example.  Note that the user name and a time stamp for versioning is also added to the map.


  • The Legend is printed on a separate map and will typically look like the following example.
 
 
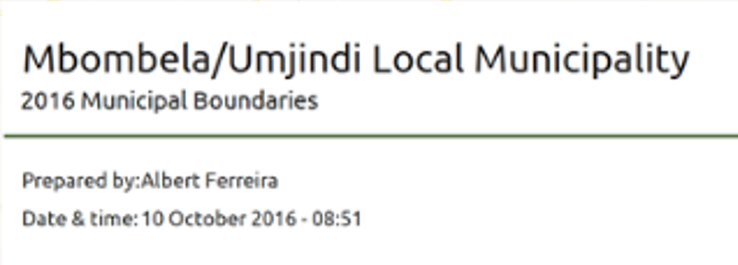
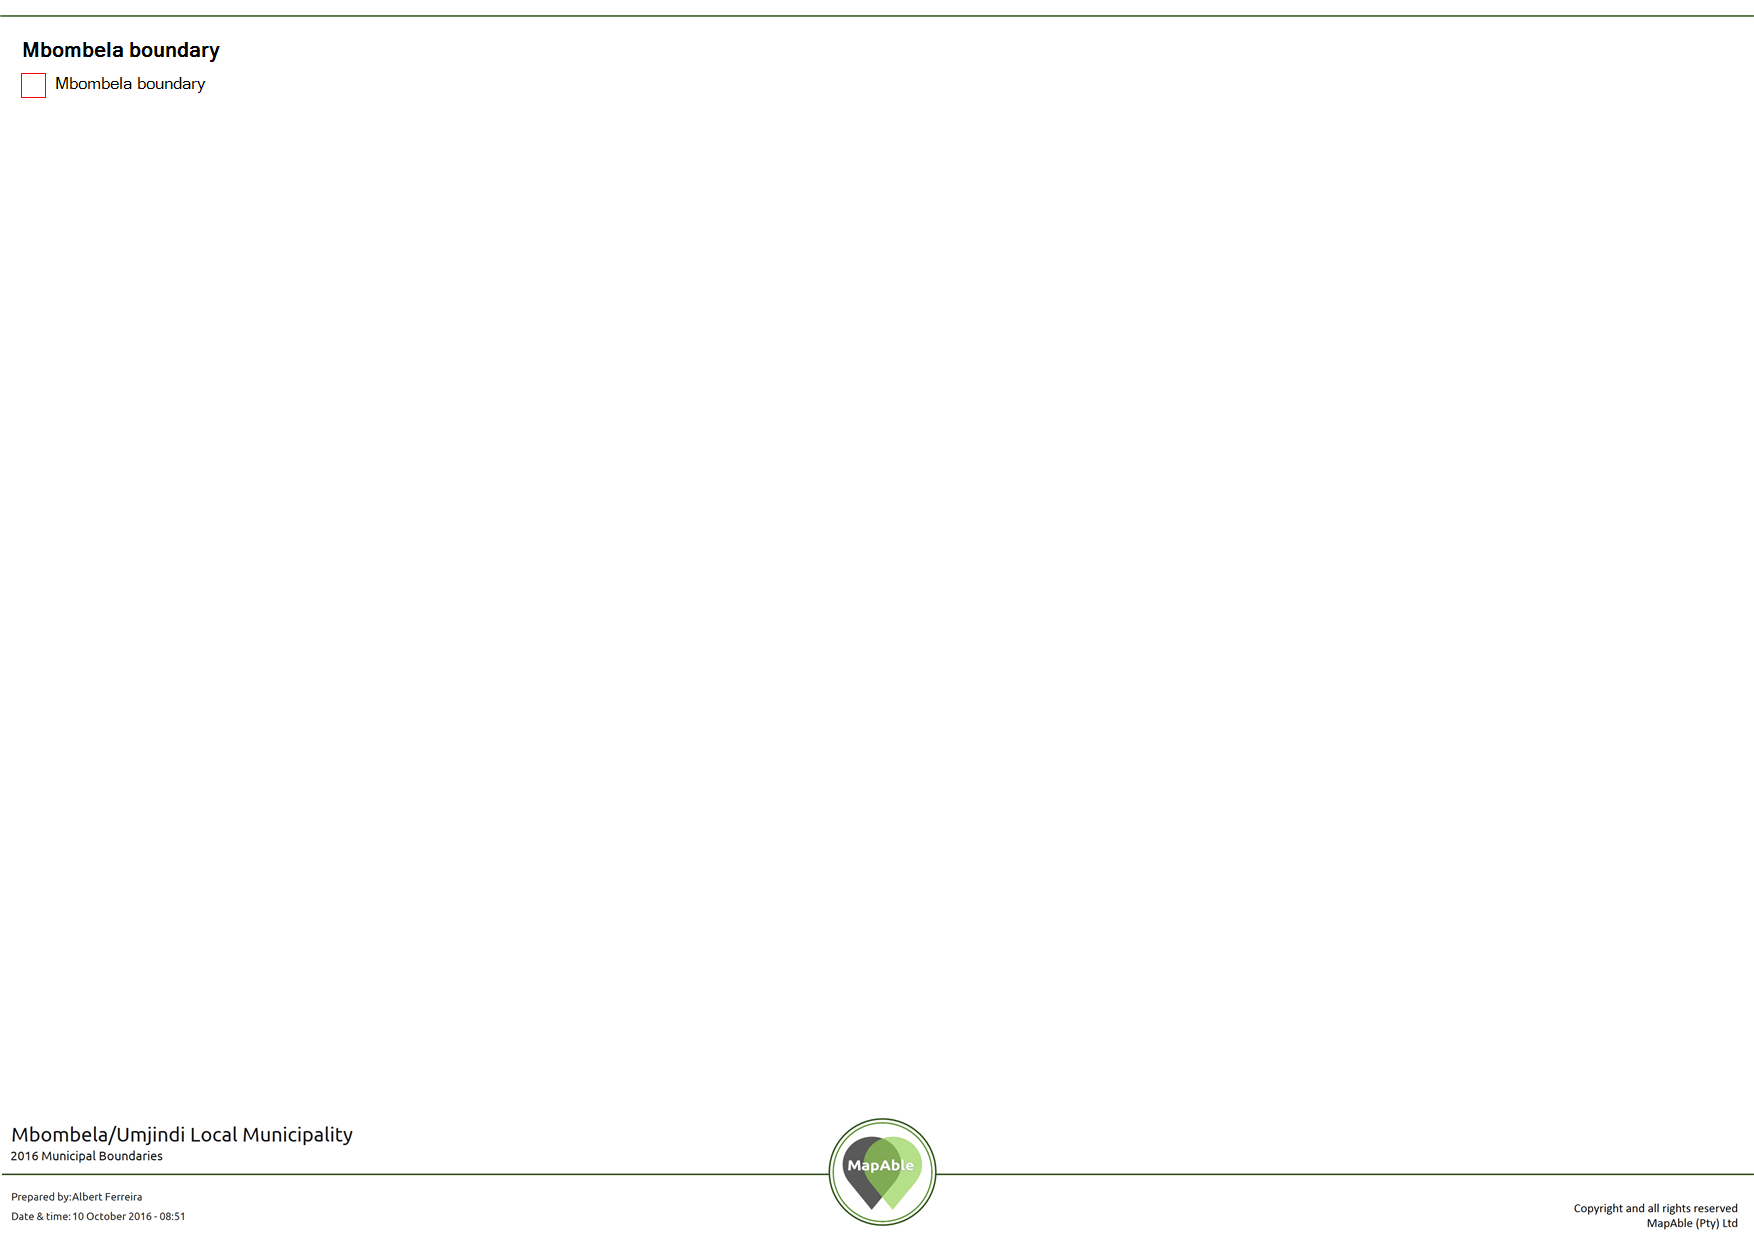
 Using a separate page for the legend has the following advantages:
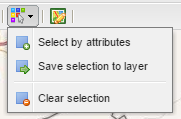
 
  • Does not clutter the map area,
  • Layers with very long legends can be added without it being flowing of the map,
  • Users have more options when adding the maps to a document for publication,
  • The legend can be edited and clipped in a graphics editor.
              
6

Add layers

6. Add layers
This dropdown lists functions as a quick access tool to load layers.
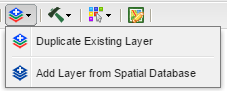
You can load a layer via the duplicate existing layer function as well as adding a layer from the spatial database. (See Content tab for more information)
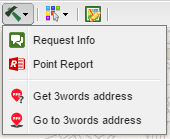
7

Tool menu

7. Tool menu
The tool menu dropdown contains the Request Info, Point Report and What3Words functions.
 
 
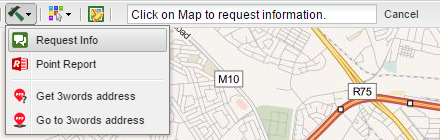
The request info button lets the user communicate with other users, team members and even MapAble® staff to ask questions or comment on specific issues related to a specific location.  Once the Request Info button was clicked, MapAble® will ask the user to click on the relevant position on the map.  The following popup box appears in the menu bar:
 
 
Once the user clicked on the specific location on the map, the following dialog box appears on the screen and needs to be filled in:
 
 
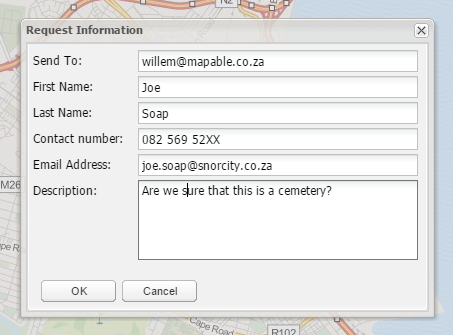
The user gives his contact details and add the question or note in the description box.  Once this is done, the email will be send by clicking the OK button.  The email will typically look like this example:
 
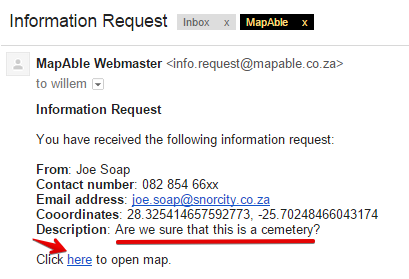
In the email the following information will be shown:
  • The contact details of the sender,
  • The coordinates of the point on the map
  • The message or request.
 
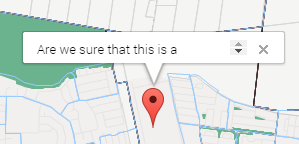
The receiver can now click on a link which will open the specific map with all the layers that was active in MapAble® in a browser. The specific point and the comment or question will appear next to the map as in the following example:
 
 
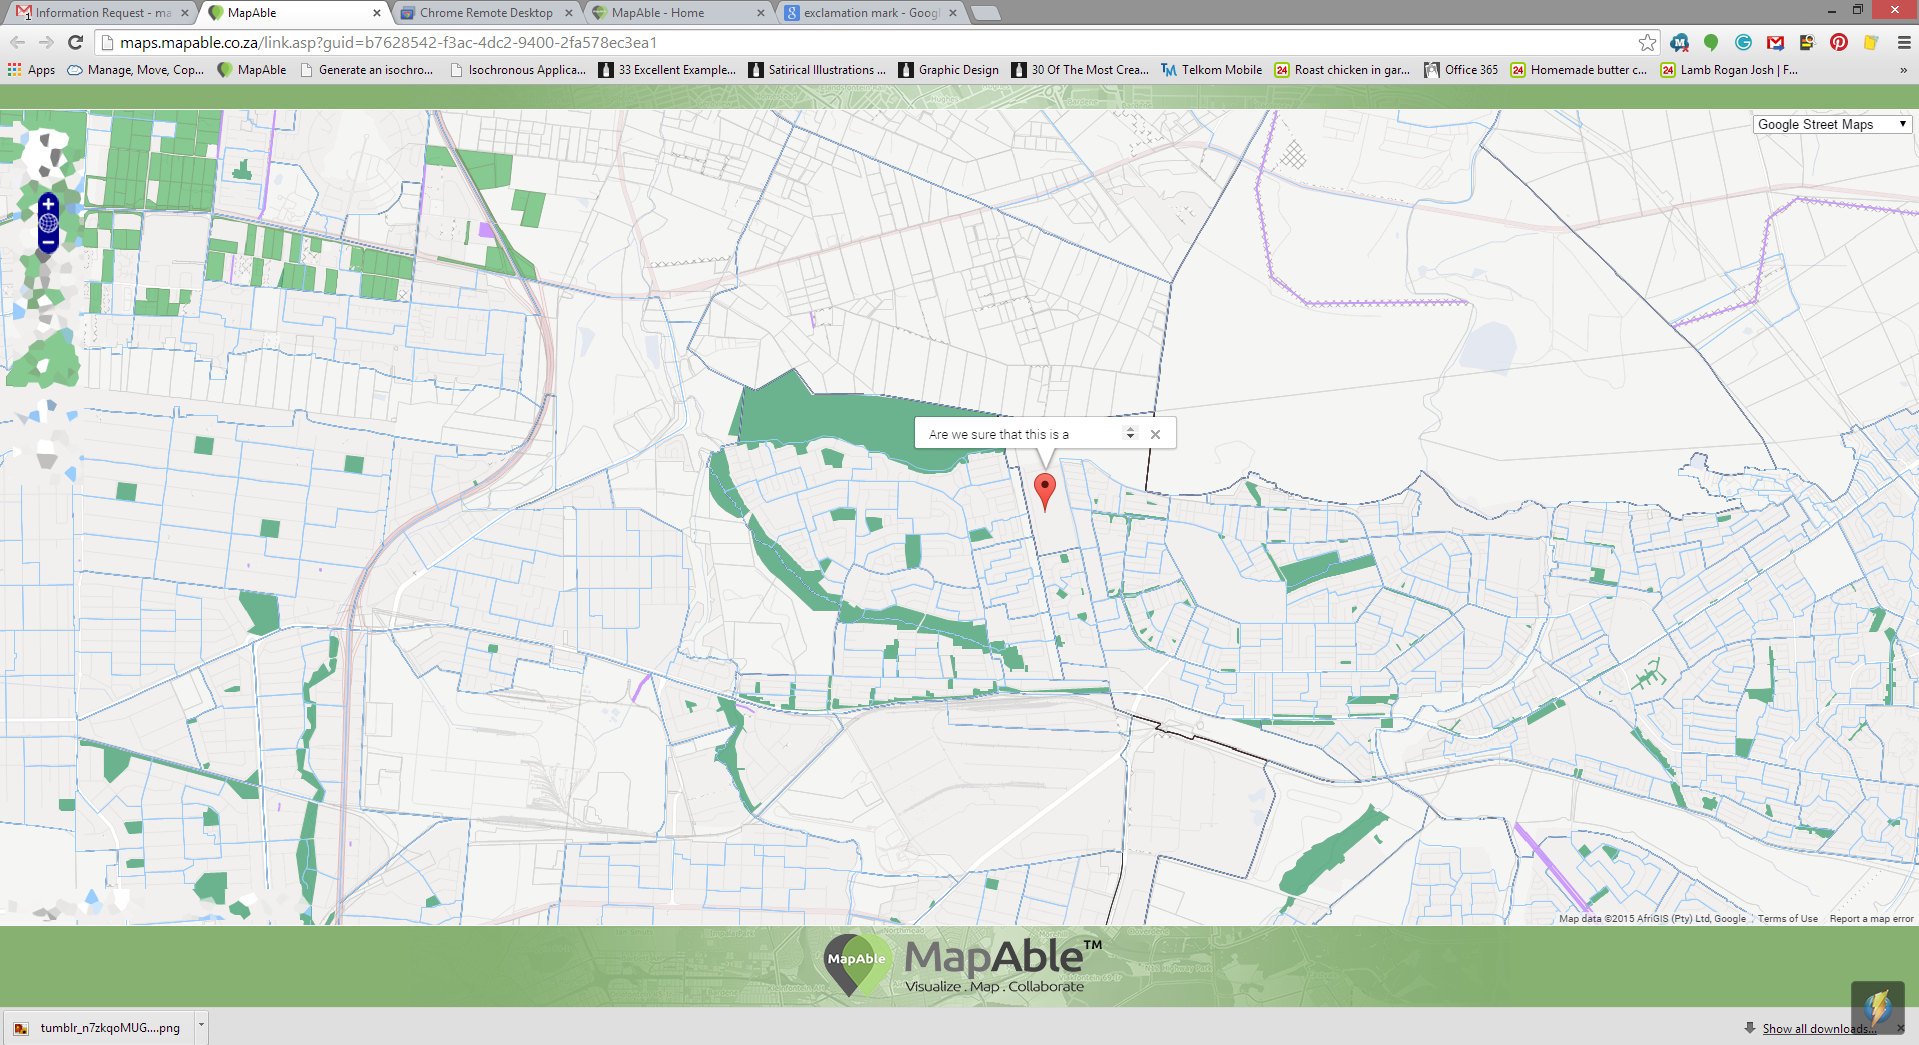
The specific location will be indicated by a red marker with the text attached to it:
 
 
For Point Report see Reporting methods.
 
MapAble® has integrated What3Words functions that can be accessed via the tool menu.
 
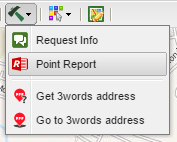
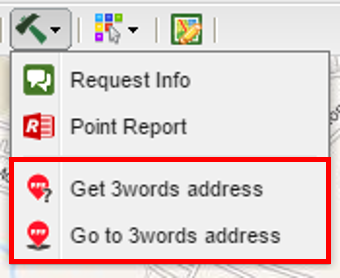
The first function is to click on any place on the map, which generates a unique What3Words address.
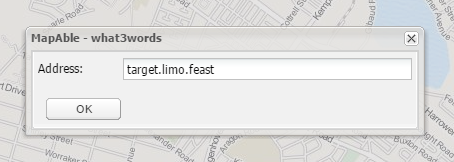
The second function is to type into the textbox a unique What3Words address and you will be taken to the location.
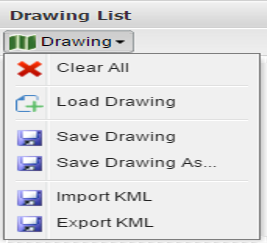
 
 
8

Selection Menu

8. Selection Menu
 
The selection menu lets you select by attributes. This means that you can select specific features of various layers. 
 
Click on the 'Select by attributes' button and this will open up the 'Select by attributes' box. The first step is to select the relevant layer, you want to select an attribute from. In the case below we wanted to select all the areas where Dolomite is present. To do this, select the layer and choose the relevant field (double click on the field, which creates the field within the query). After clicking the field, all the unique values will appear. To complete the query, select the relevant boolean search terms (Controls) such as equals (=); larger than (>); smaller than (<), doesn't equal (!=), bigger and equal to (>=), smaller and equal to (<=), AND (both terms), IS (exact term), OR (both), LIKE (contains phrase - strings) and '(' ')'. Complete the query in this case "LITHO_1 = 'Dolomite' which means all geological features that are dolomite will be selected.  
 

After you click OK the layer will be made visible. If you are satisfied click the selection menu again and select 'Save selection to layer' or 'Clear selection'.
 
 
After clicking 'Save selection to layer' a new layer will be created in your list of layers, where you can edit the features of the layer.
 
9

Drawing controls

9. Drawing controls
The Drawing controls is a set of tools enabling the user to draw point., lines and polygons on the map and save them for later use or to collaborate with other team members. 
 
For a more detailed description of the drawing tools, please go to the Drawing Tools section by clicking here.
 
The user can activate the drawing controls by clicking on the Drawing controls button.  A new toolbar will appear at the bottom of the view pane:
 
 
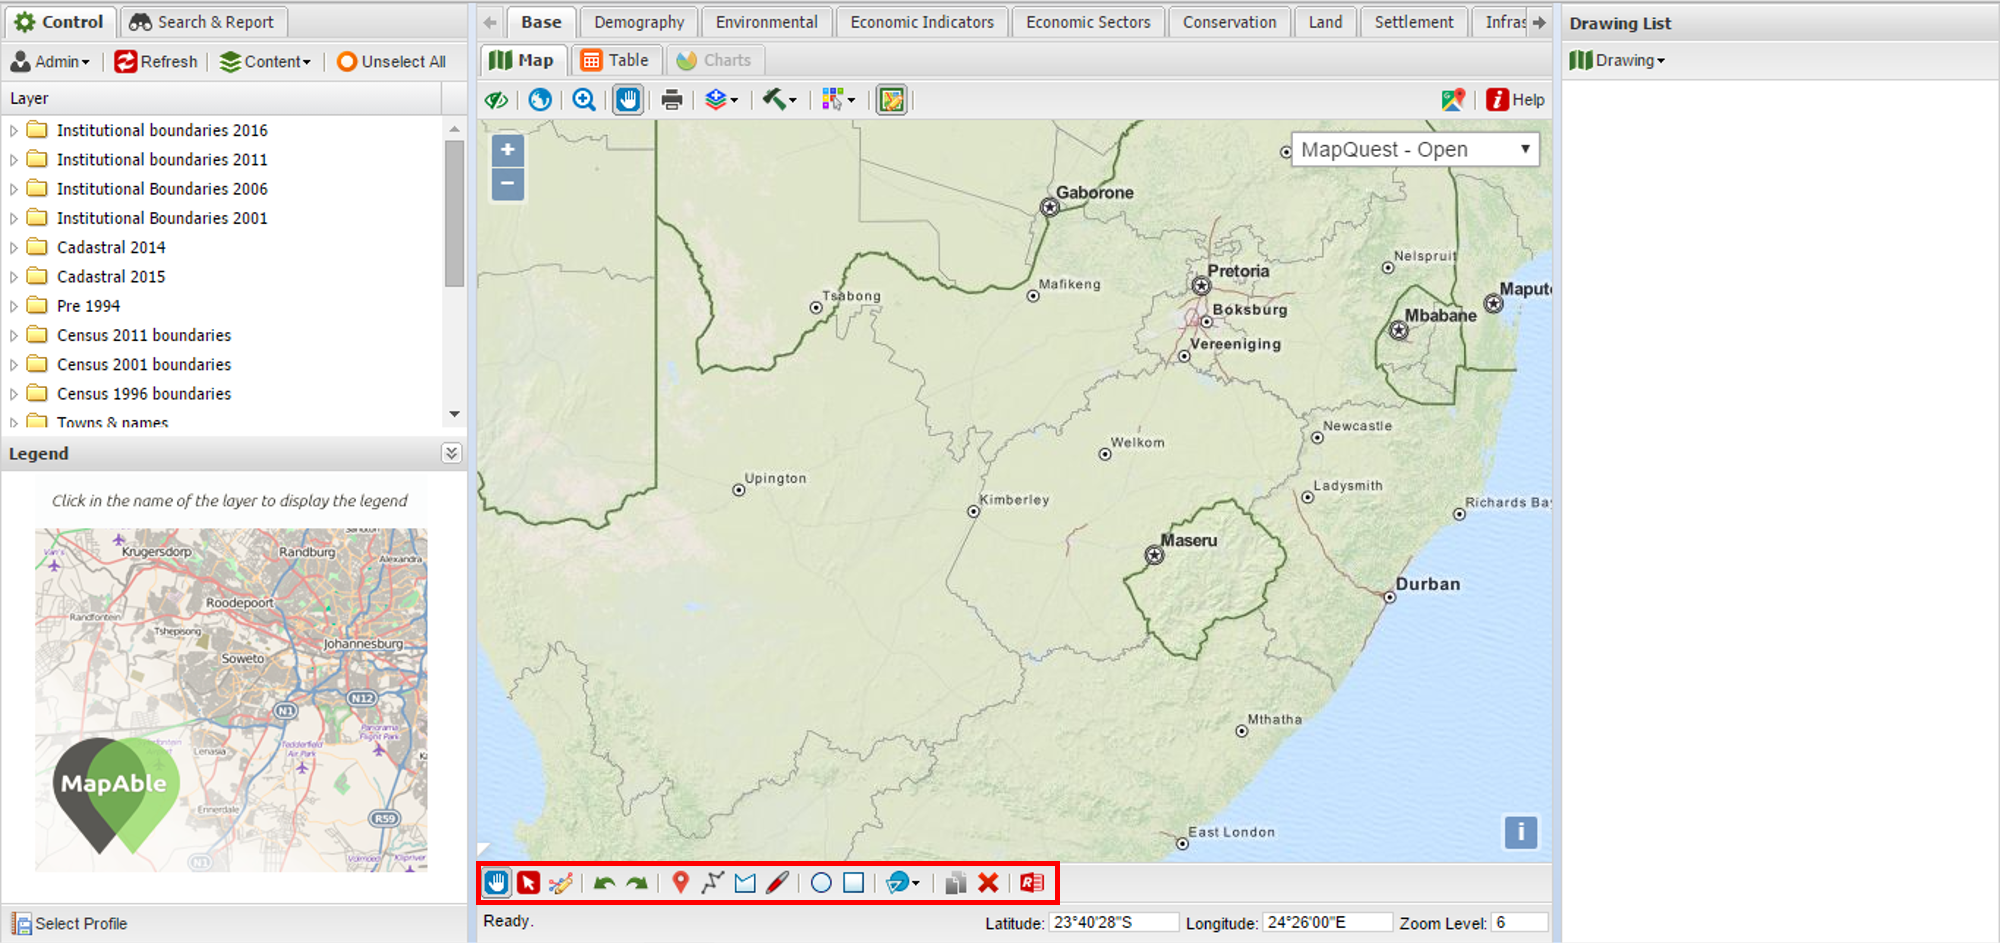
The drawing control bar has the following tools:
 
 
The user can choose colours, line thickness and type of drawing tool to draw on the map.  The drawing size will always stay on the scale of the map even if the user zoom in or out.
 
 
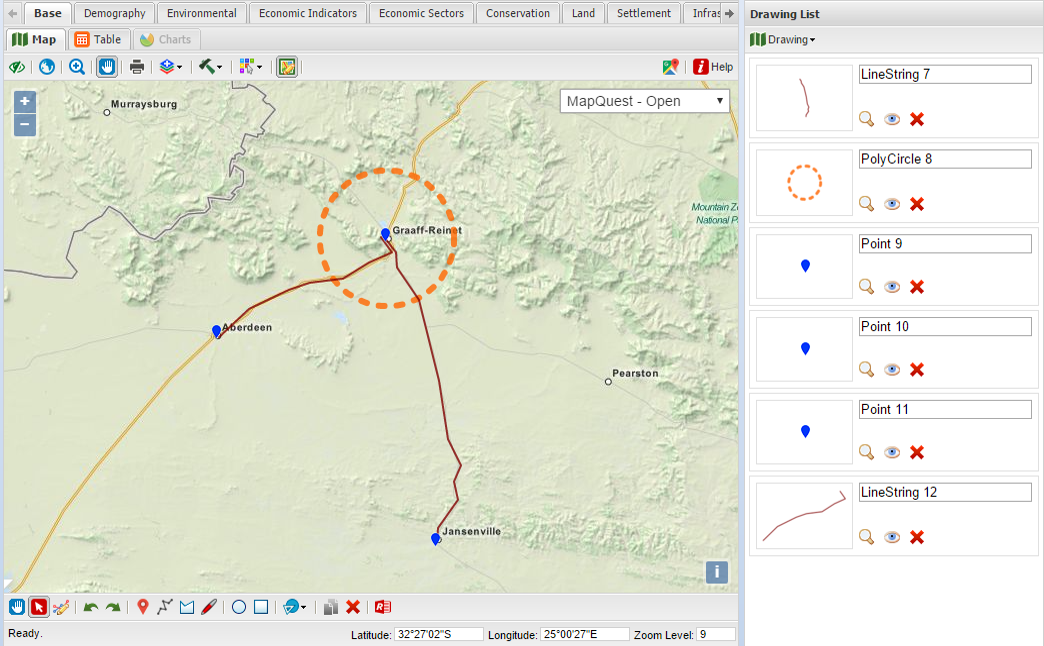
Once finished, the user can save the drawing in his personal user library. You can also export your drawing as a KML or import a KML to your workspace.
 
 
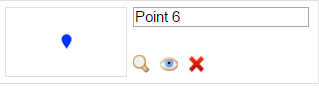
You can select each individual drawing from the drawing list. You can zoom to the drawing by clicking on the magnifying glass, switch the drawing on and off, delete the layer and change the name of the drawing.
 
For a more detailed description of the drawing tools, please go to the Drawing Tools section by clicking here.
 
 
10

View in Google Maps

10. View in Google Maps
To see your current map extent in Google Maps®, simply click on the Google Maps® link to the top right of the Map view.
 
 
After you click on the Google Maps® link, a new window will open up with the same map extent viewed in your MapAble® workspace.
 
 
Please note: 
The use of Google Maps® for commercial purposes is subject to copyright. Please make sure not to infringe on any ownership or copyrights when using it.  MapAble® added the link to free Google Map services for information purposes only and strongly discourage users to use them for publication of any maps from the MapAble® service.


11

Help

11. Help
This opens up this help file from your workspace