
Data Visualisation
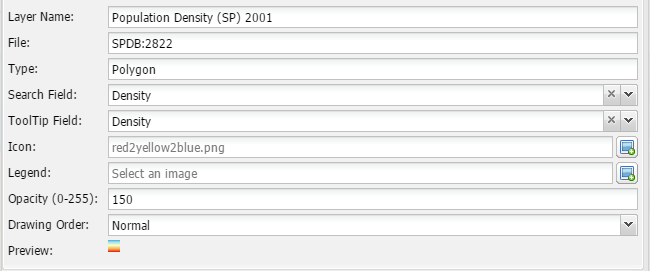
The data Visualisation Inputs dialog Box can be accessed by double clicking on a data layer in the list of layers or via the Content>Edit layer button.
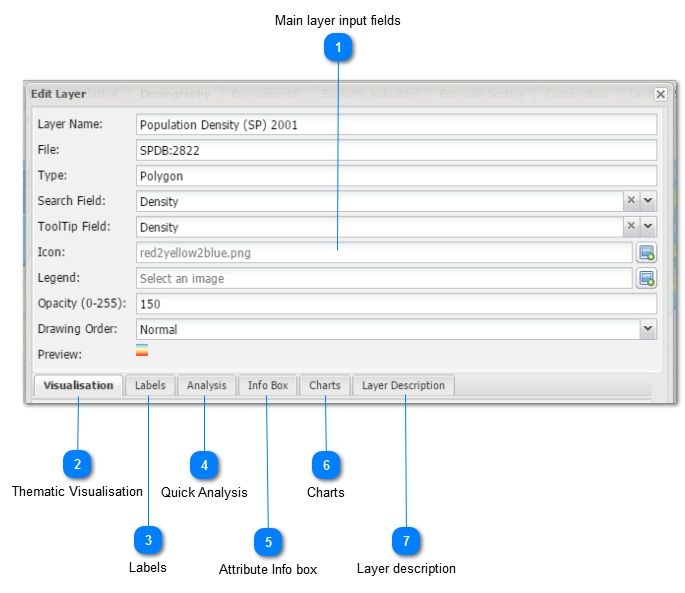
Thematic VisualisationThematic visualisation is a set of tools were the use can create thematic maps:
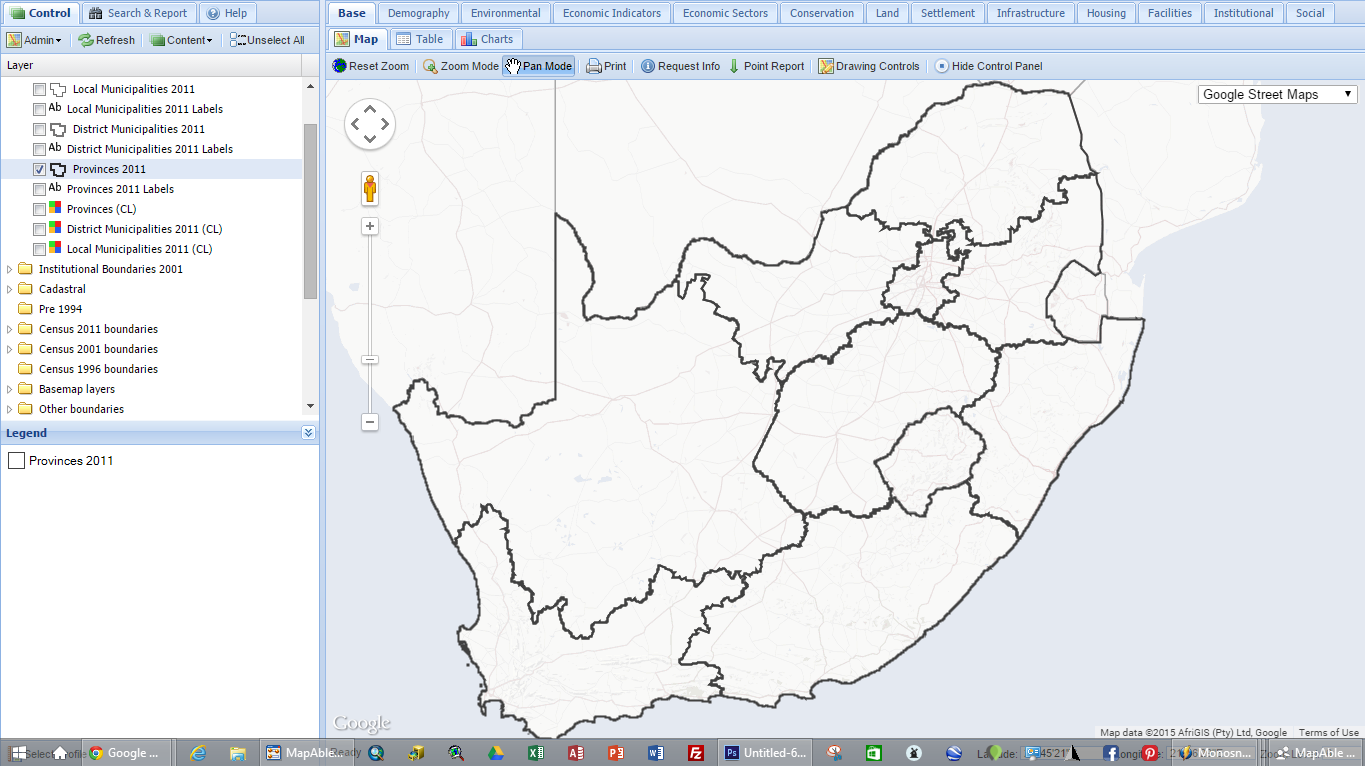 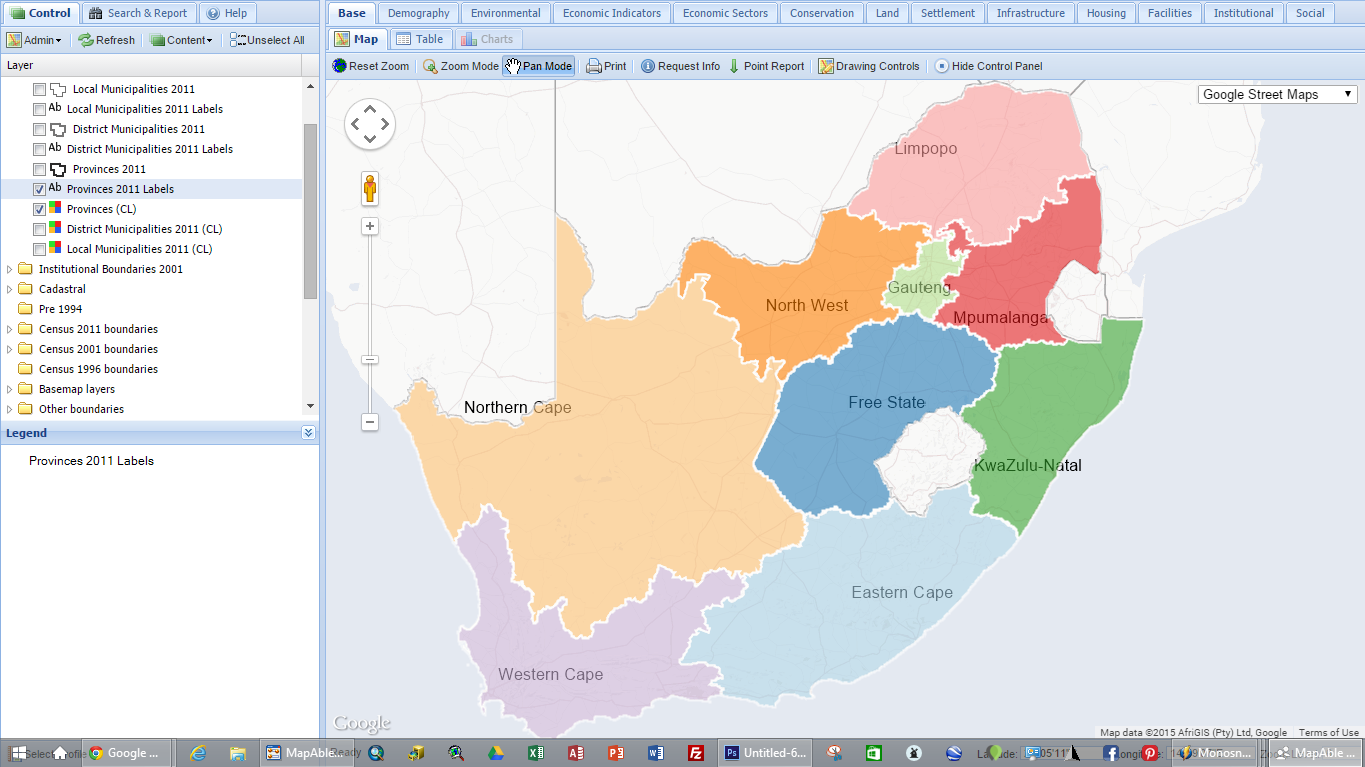 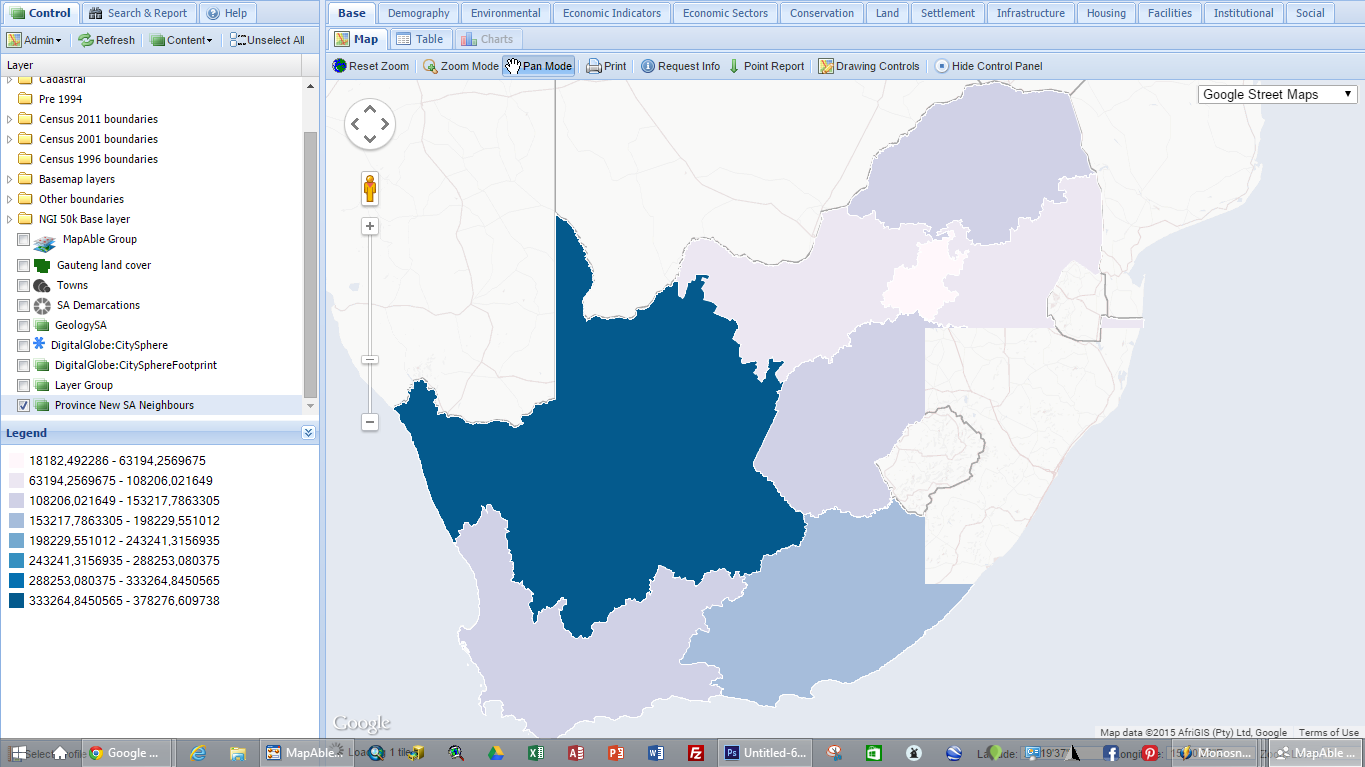 The visualisation of a layer can be set in the Visualisation toolbox. The user can choose between the thematic mapping choices and and the available or custom color palettes. For a detailed description on how to change on the visualisation of a layer, please go to the Thematic Visualisation section.
|
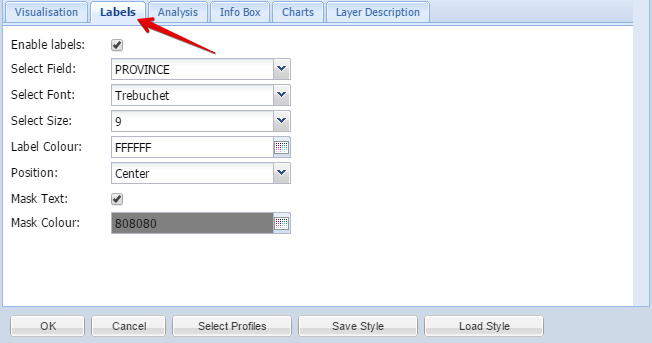
Quick AnalysisThe Quick Analysis tool is one of the most powerful MapAble tools. With this tool, a user can add to the current attributes of a layer by doing small spatial queries related to other layers in the workspace. An example is to calculate how many schools are in a province. The user can add the query and the answer will be added to the Attribute info box when attributes are viewed.
| ||
Attribute Info boxThe attribute Info Box displays all the attributes in the attribute table of an on-screen selected entity of a data layer.
The user can view the attributes in an automatically generated Info Box or create a custom Info Box in MSWord® or MSExcel®:
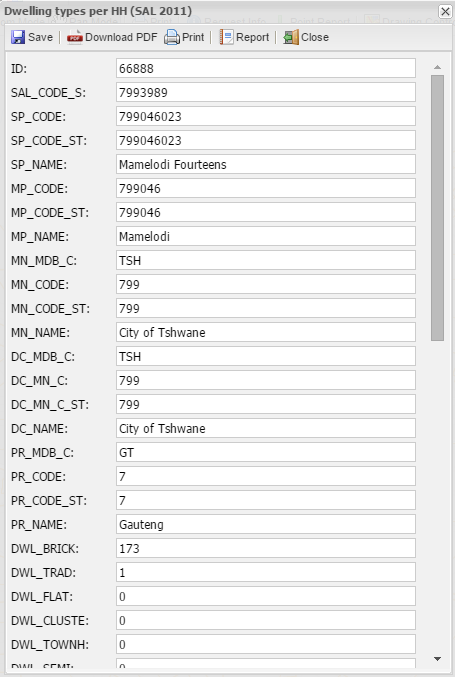 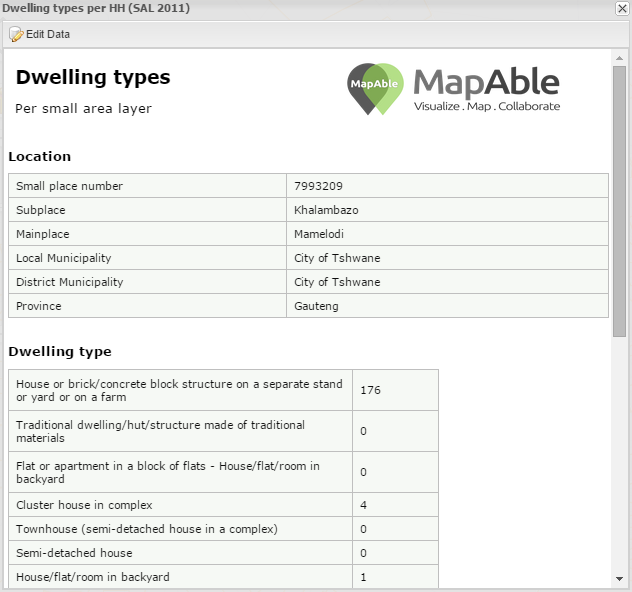 The automatically generated info box are default for every imported layer. On how edit it or create custom info boxes, please refer to the Attribute Info Box section for a detailed description.
|
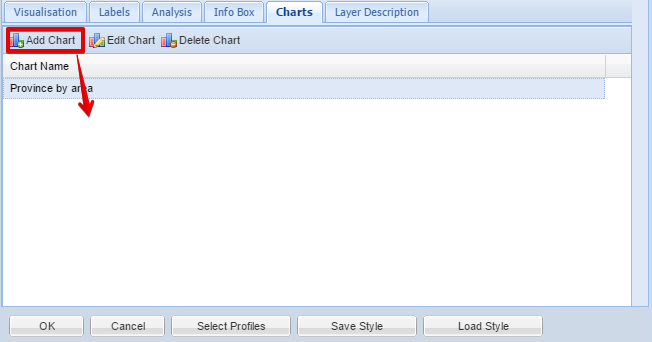
ChartsThe Charts tool gives the user a quick way of creating either a Bar or Pie chart based on the contents of the attribute table.
To create a chart, the user needs to Add a new chart in the list of charts:
 The following input box will appear:
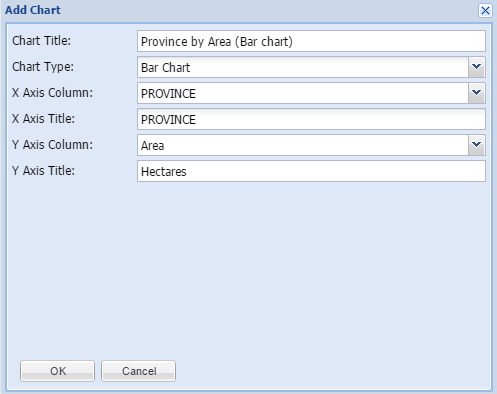 The user can add the necessary inputs for the X and Y Axis and decide on the type of chart. When all the inputs are finalised, the user can hit the OK button and the new chart will appear in the list:
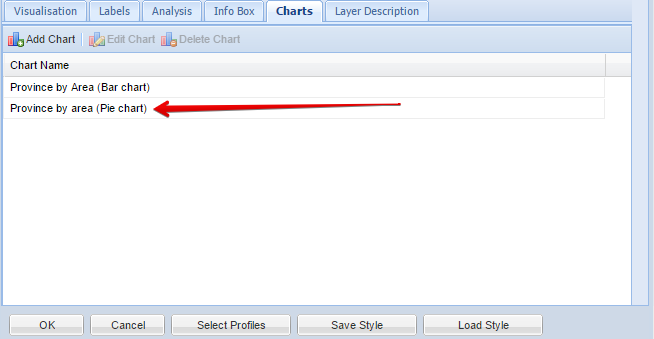 The user can edit or delete the chart at any time later on.
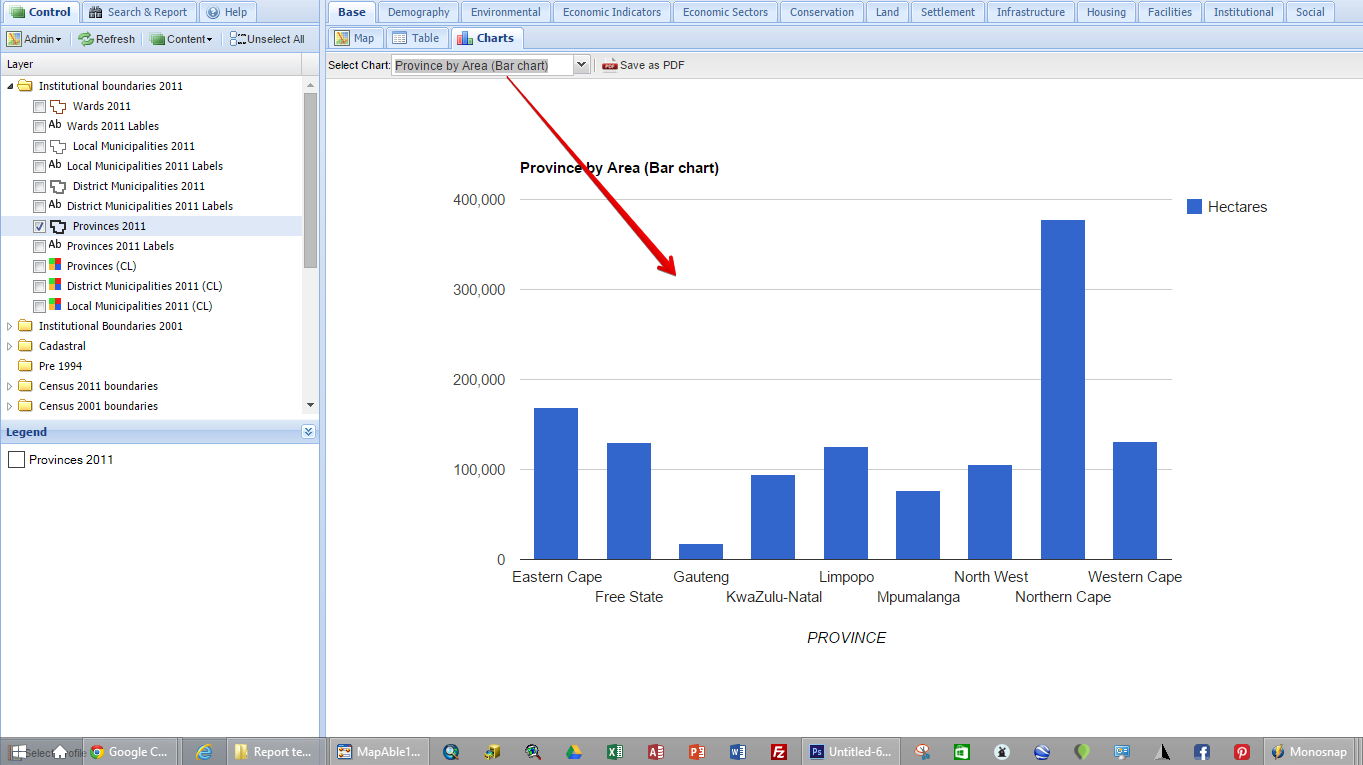
To view the chart the user should go to the Charts button in the View Pane and activate the Charts mode:
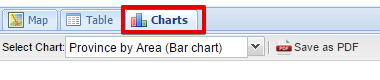 Now the user can choose one of the predefined charts in the selection list:
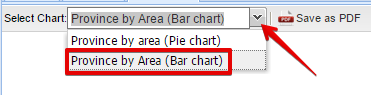 The predefined chart will now appear in the View Pane which is in Charts Mode
 |
Layer descriptionThe Layer description displays the information form the Metadata inputs which was done in the uploading process with the Data Uploader.
The user can refer to the information at any time. This is especially handy when info is needed during the process of doing the thematic visualisation or labeling of fields
When the user open the Layer description, it will typically look like this:
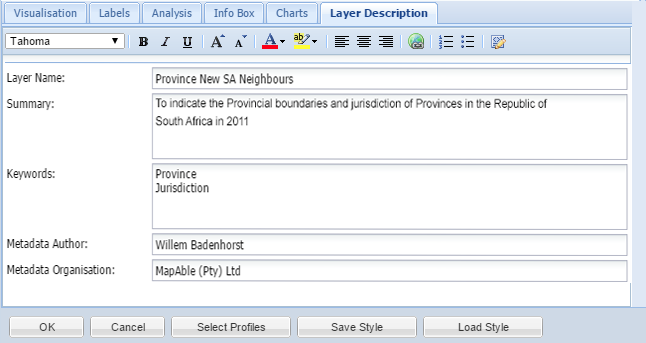 |