Reporting methods
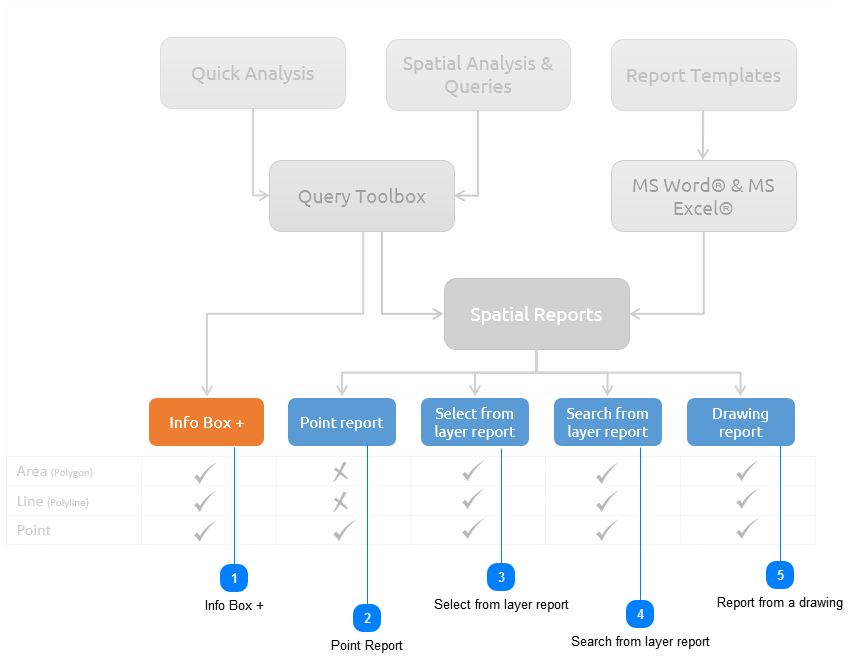
Once Report Queries and Report Templates are set up, they can be executed indifferent ways in MapAble. The following section will describe the different ways in detail:
Info Box +The info box plus is the most basic way of viewing a Quick Analysis. To access the Info Box, the user clicks on a spatial entity on the map and displays the attributes as contained in the attribute table of the layer.
For more info on the Quick Analysis please go here.
|
Point ReportThe Point Report is the most easy way of creating a report. The point report will display reports which was designed to be used for point features.
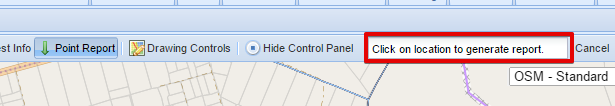
To execute a point report, the user clicks on the point report button when in Map Mode:
Once the Point report button was clicked, a popup box will appear on the menubar to ask the user to click on a position on the map for which a report should be generated.
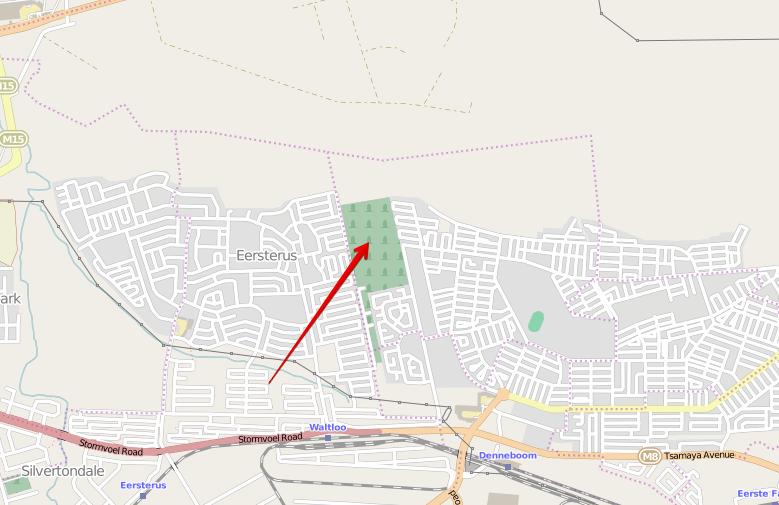
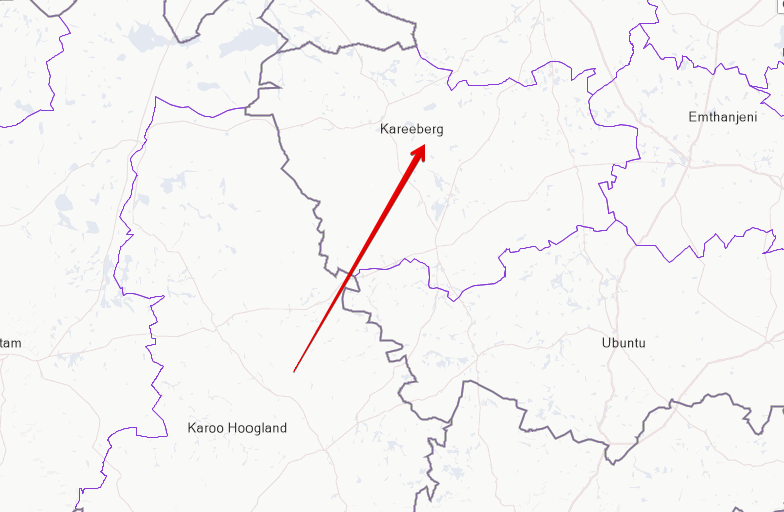
 The user click on the desired location on the map with the mouse:
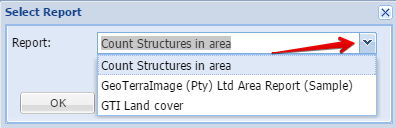
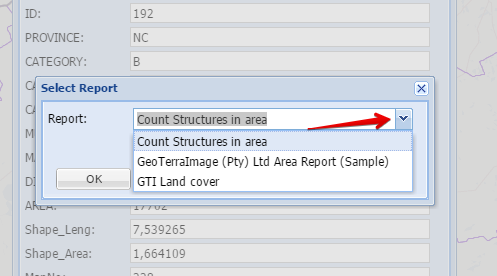
 After the user indicated the specific point on the map, the following list box will appear:
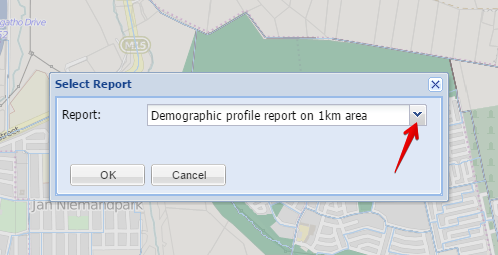 By clicking on the drop down button, the user can select the specific report to generate.
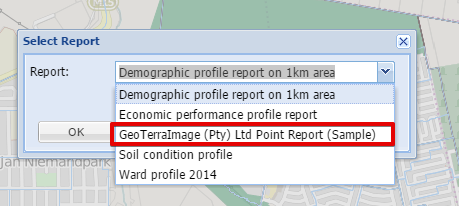 The user hits the OK button and the MapAble server will start to generate the report from the spatial database. The process will be indicated by the following info box:
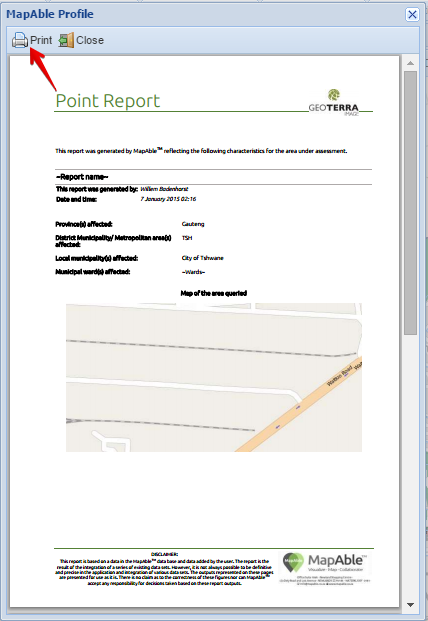
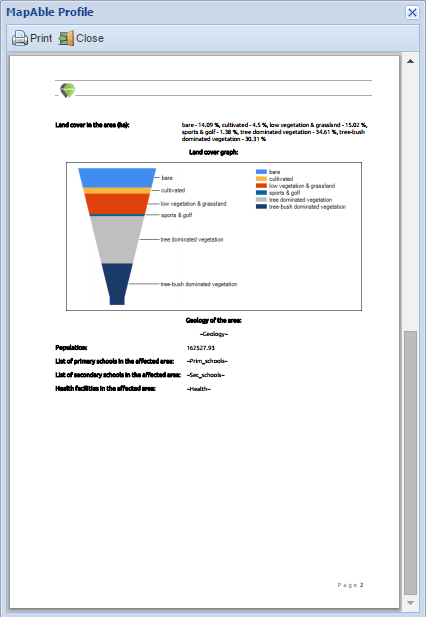
 Once the report is complete, the user can print the report via the normal printing method by printer of .PDF
| ||
Select from layer reportThe select from layer report lets the user select a specific layer in the List of Layers and click on the map on the desired location to create a report. This function is to be used when the user knows exactly what the location of the study area is which needs to be reported on. The study area boundaries will be base on the selected layer. (e.g. Wards).
First the user selects the desired layer:
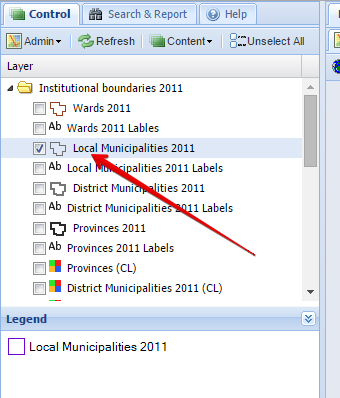 The layer will be displayed in the map, from which the user can select a study area.
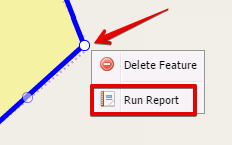
 When clicking on the study area, the Info Box will appear. On the Info Box, the Report Button will be in the menu bar:
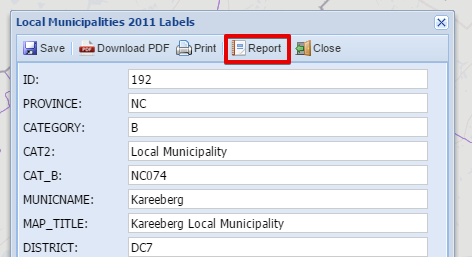 A dropdown box with all available reports for the specific layer type (polygon, line, point) will be displayed from which the user can select one.
 After selection the user hits OK and the report gets generated.
|
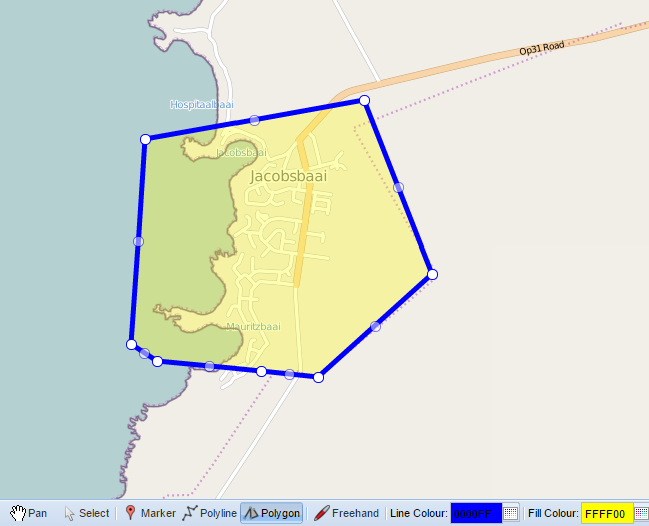
Search from layer reportIn the case where a study area's location is unfamiliar with a user, the search and report function can be used to select a study area.
Once a study area is selected, the map will zoom to it:
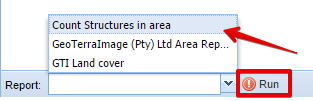
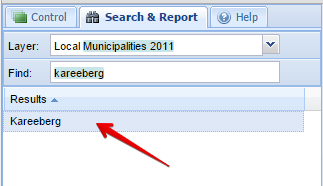 Once the study area is selected, the Report can be selected at the bottom left corner of the List of Layers box:
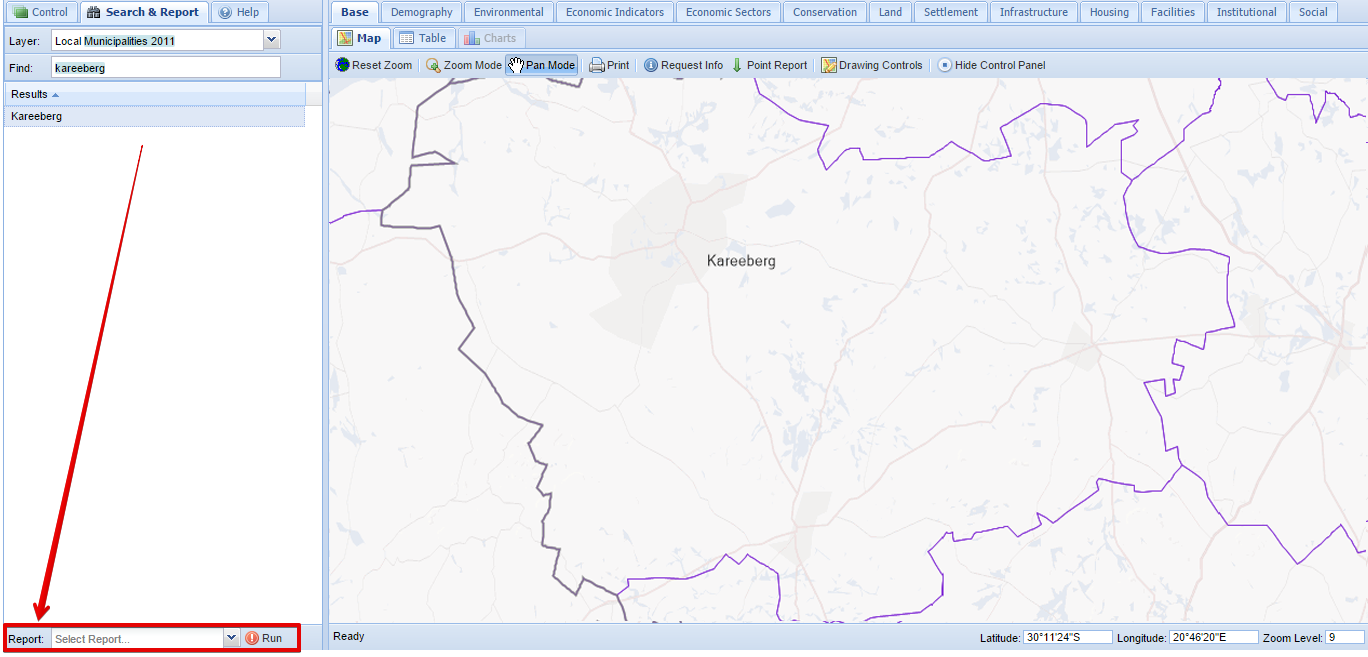 The user can select the desired report and hit the RUN button to execute
 |